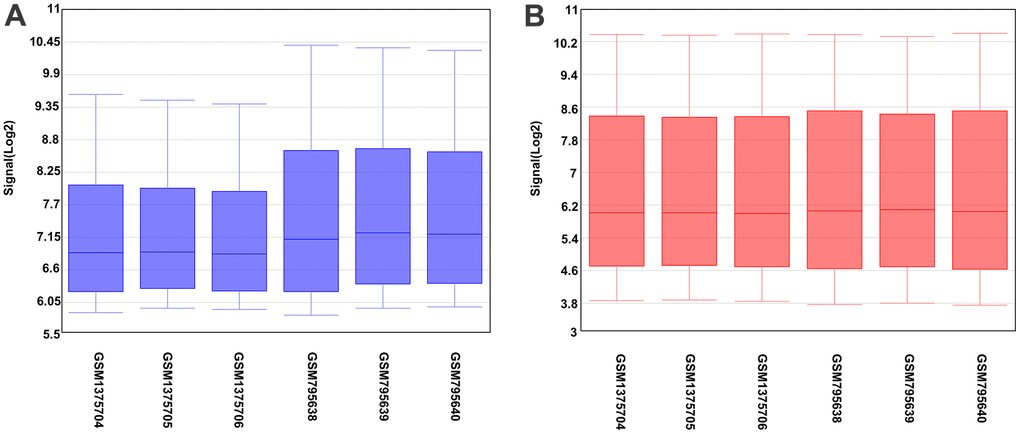
Figure 1.Box plot of sample data. The abscissa of the box plot indicates the sample names and the ordinate represents the sample expression value. (A) Before the standardization. (B) After the standardization.
Figure 1 — Network analysis for the identification of hub genes and related molecules as potential biomarkers associated with the differentiation of bone marrow-derived stem cells into hepatocytes | Aging