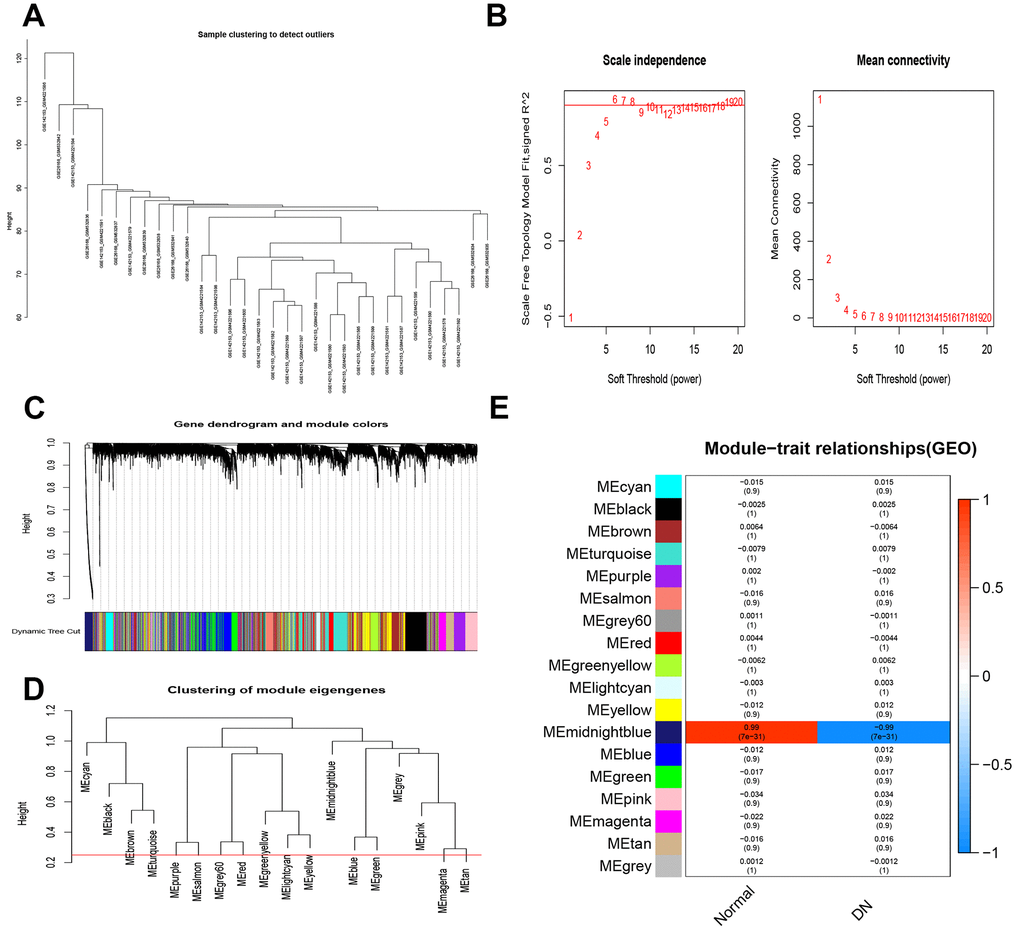
Figure 2.Weighted gene co-expression network analysis. (A) Sample clustering. (B) Analysis of soft-thresholding powers to fit the scale-free topology model and the mean connectivity of the soft-thresholding powers. (C) Dendrogram of the gene modules. (D) Clustering of 8 gene modules. (E) Module-trait relationships.