Submit an Article
Navigate
Home
Editorial Board
Editorial Policies
Current Volume
Archive
Scientific Integrity
Publication Ethics Statements
Interviews with Outstanding Authors
Newsroom
Sponsored Conferences
Podcast
Contact
Special Collections
Submit an Article
Online ISSN: 1945-4589
Research Paper
|
Volume 14, Issue 19
|
pp. 8001–8012
Sex difference in the association between pathological albuminuria and subclinical atherosclerosis: insights from the I-Lan longitudinal aging study
Back to article
Figure 2
(2 of 2)
−
100%
+
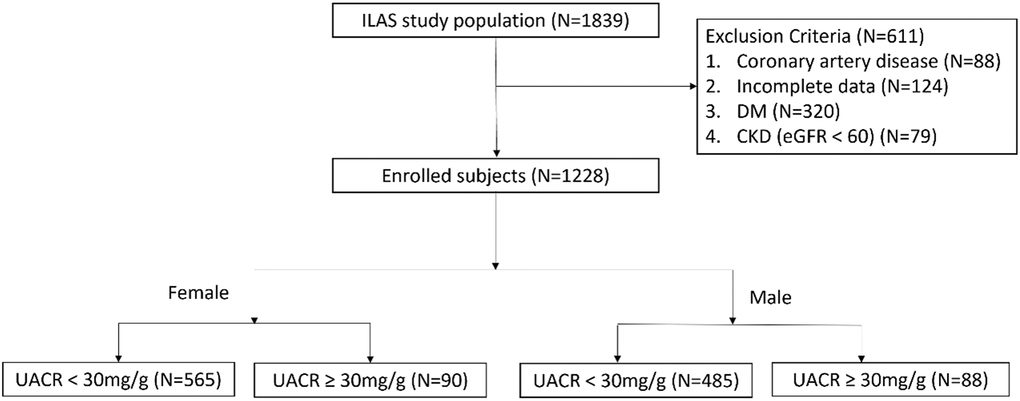
Figure 2.
Flow chart of patient enrollment.