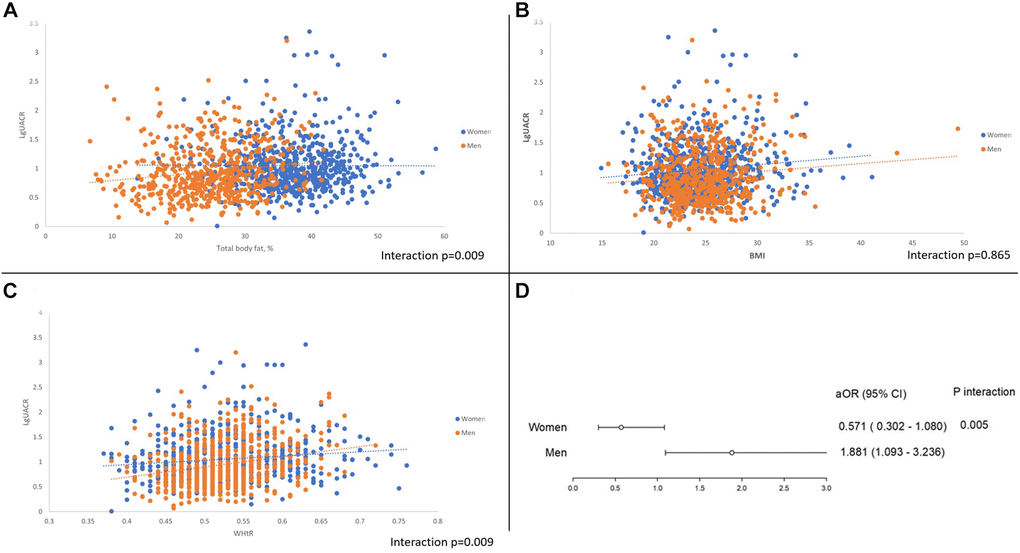
Figure 1.(A) Gender disparity between UACR and total body fat percentage. (B) Gender disparity between UACR and BMI. (C) Gender disparity between UACR and Waist to height ratio. (D) Pathological albuminuria and the adjusted odds ratio of subclinical atherosclerosis between sex.