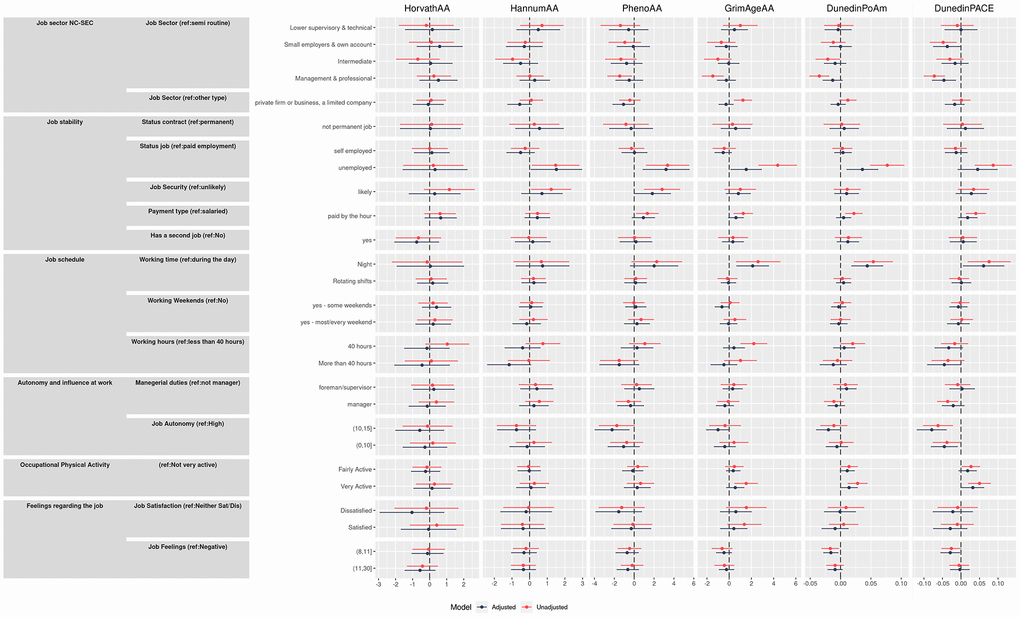
Figure 2.Effect size and 95% confidence intervals for adjusted males and females models (interpretable as years of increase/decreasing epigenetic age) of the association between primary outcomes and the four epigenetic aging biomarkers and the pace of aging.