Submit an Article
Navigate
Home
Editorial Board
Editorial Policies
Current Volume
Archive
Scientific Integrity
Publication Ethics Statements
Interviews with Outstanding Authors
Newsroom
Sponsored Conferences
Podcast
Contact
Special Collections
Submit an Article
Online ISSN: 1945-4589
Research Paper
|
Volume 14, Issue 19
|
pp. 7718–7733
Centenarians consistently present a younger epigenetic age than their chronological age with four epigenetic clocks based on a small number of CpG sites
Back to article
Figure 2
(2 of 3)
−
100%
+
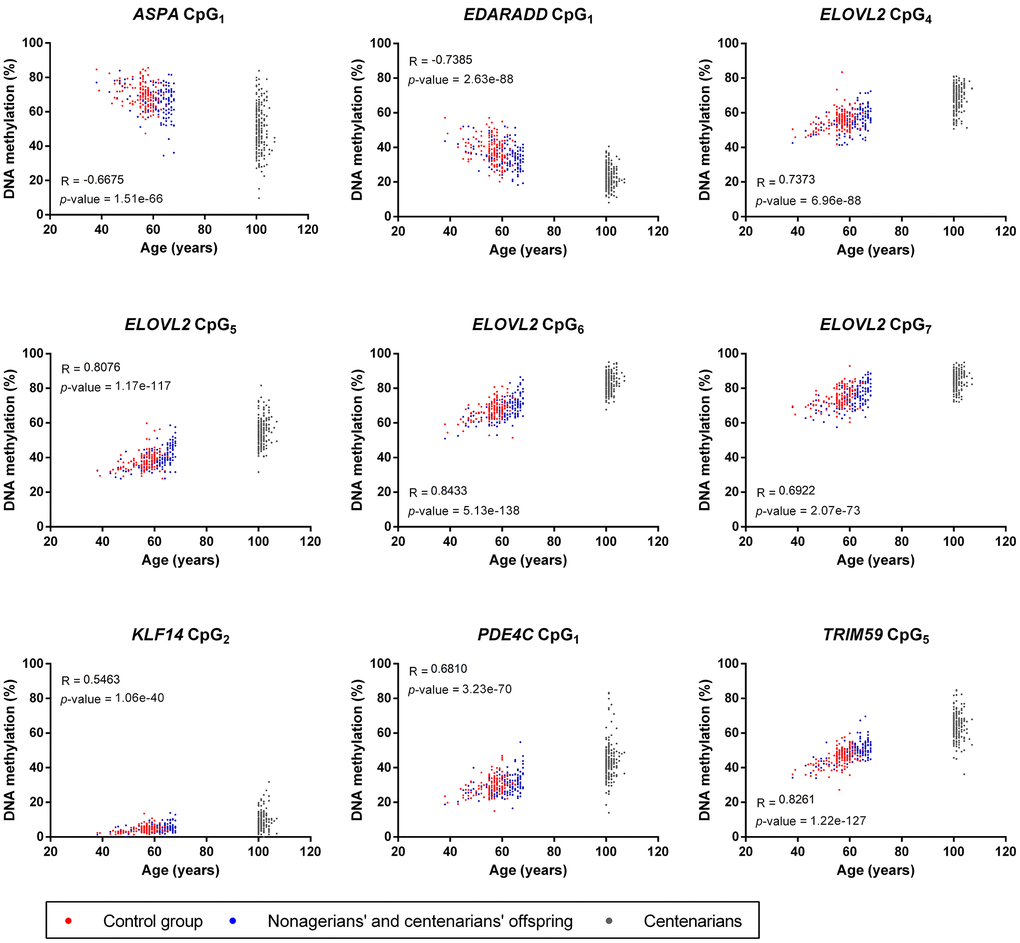
Figure 2.
Correlation analysis between the chronological age and DNA methylation from the nine CpGs included in the four epigenetic clocks used in our study.
For each CpGs, Pearson R coefficients and
p
-values are indicated on the graphs.