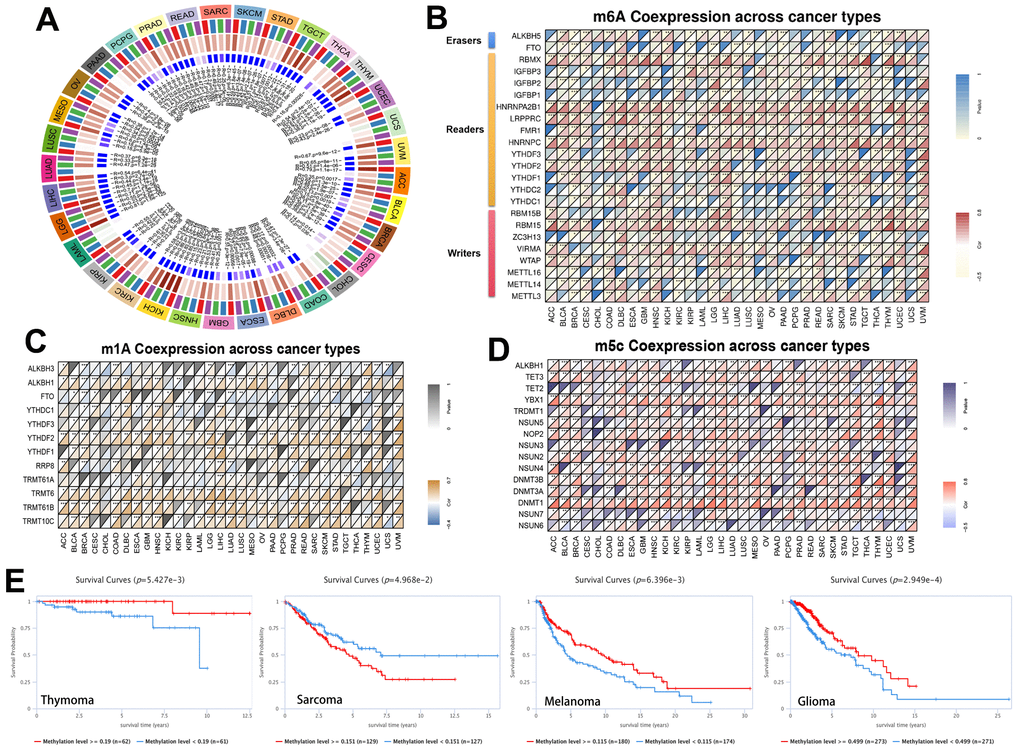
Figure 3.Methylation in RRM2. (A) Correlation between RRM2 expression level and DNA methyltransferases. DNMT1, red; DNMT2, blue; DNMT3A, green; and DNMT3B, purple. (B–D) Correlations between RRM2 expression and the m1A, m5C, m6A-related genes in different tumors. (E) Kaplan-Meier overall survival curves of different methylation levels of RRM2 in different tumors.