Submit an Article
Navigate
Home
Editorial Board
Editorial Policies
Current Volume
Archive
Scientific Integrity
Publication Ethics Statements
Interviews with Outstanding Authors
Newsroom
Sponsored Conferences
Podcast
Contact
Special Collections
Submit an Article
Online ISSN: 1945-4589
Research Paper
|
Volume 14, Issue 19
|
pp. 7877–7889
Hyperlipidemia attenuates the mobilization of endothelial progenitor cells induced by acute myocardial ischemia via VEGF/eNOS/NO/MMP-9 pathway
Back to article
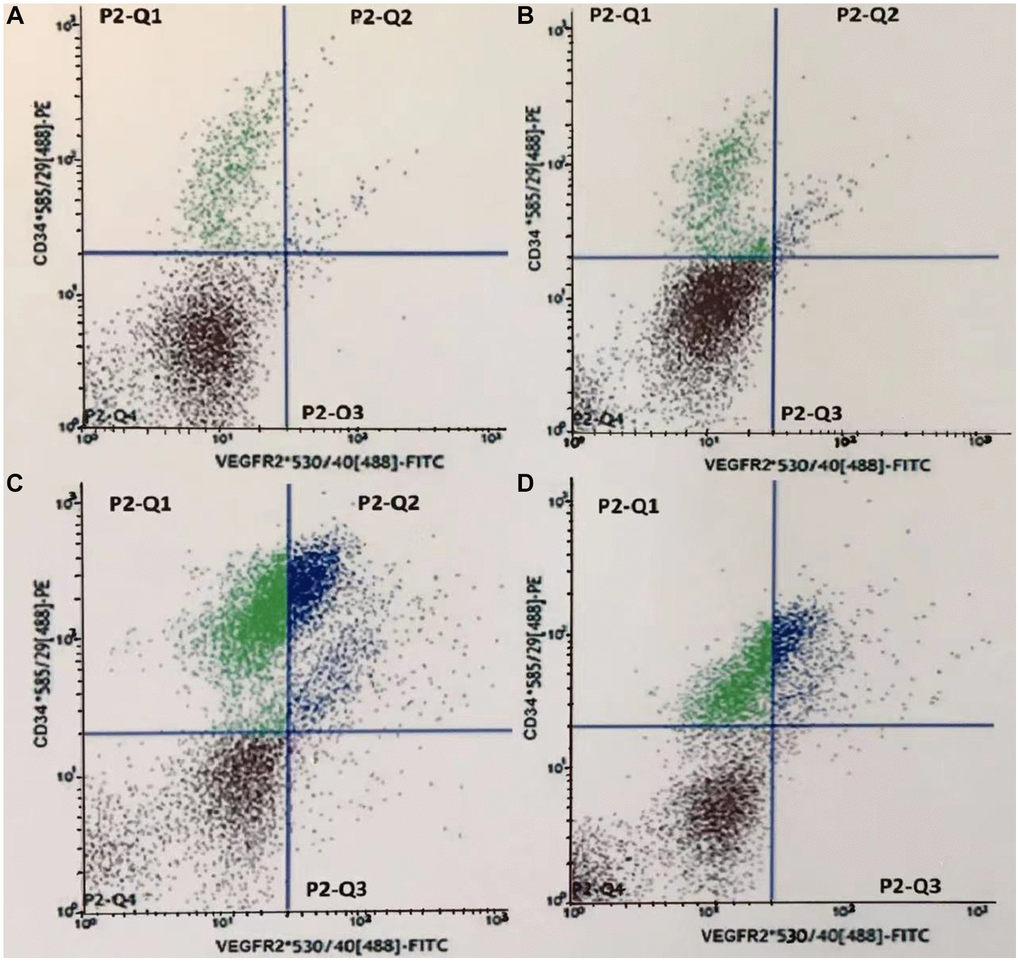
Figure 7
(7 of 9)
−
100%
+
Figure 7.
Fluorescence intensity scatter diagrams of CEPCs in the 4th subgroup rats.
(
A
–
D
) represents the Ctrl, HL, AMI, and HL-AMI group, respectively. Cells in gate P2-Q2 (PE
+
/FITC
+
or CD34
+
/VEGFR2
+
) are CEPCs.