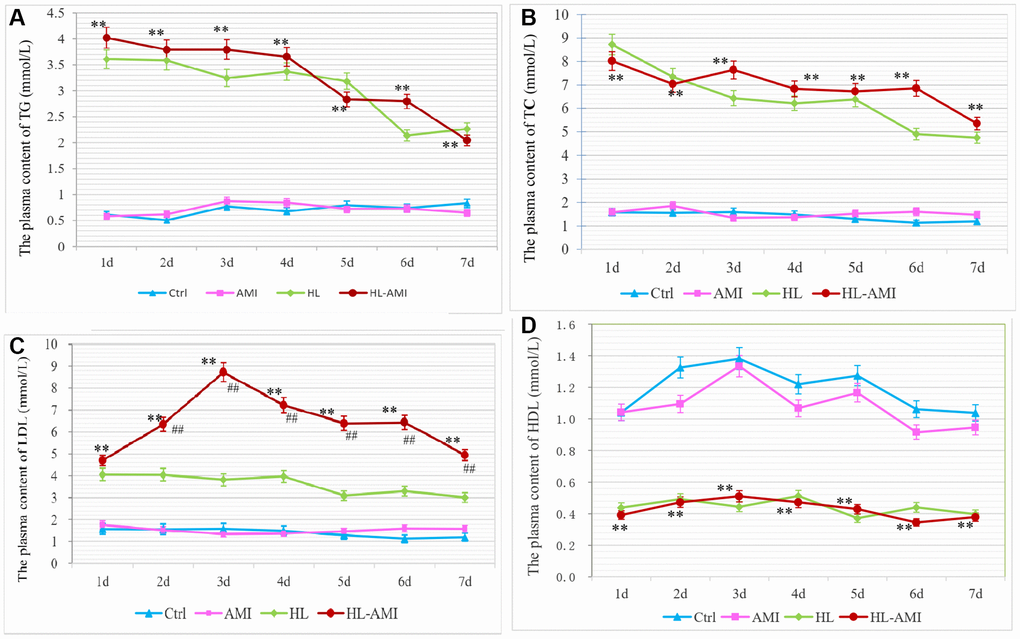
Figure 2.Change in the plasma content of TG, TC, LDL-C and HDL in each group rats during 7 days after AMI. (A–D) The plasma concentration of TG (A), TC (B), LDL-C. (C) and HDL-C (D) in rats of the Ctrl, HL, AMI, and HL-AMI group respectively. *, **, P < 0.05 or P < 0.01, compared with the AMI group. Each data point represents the average of eight rats in one group, and vertical lines indicate the SEM.