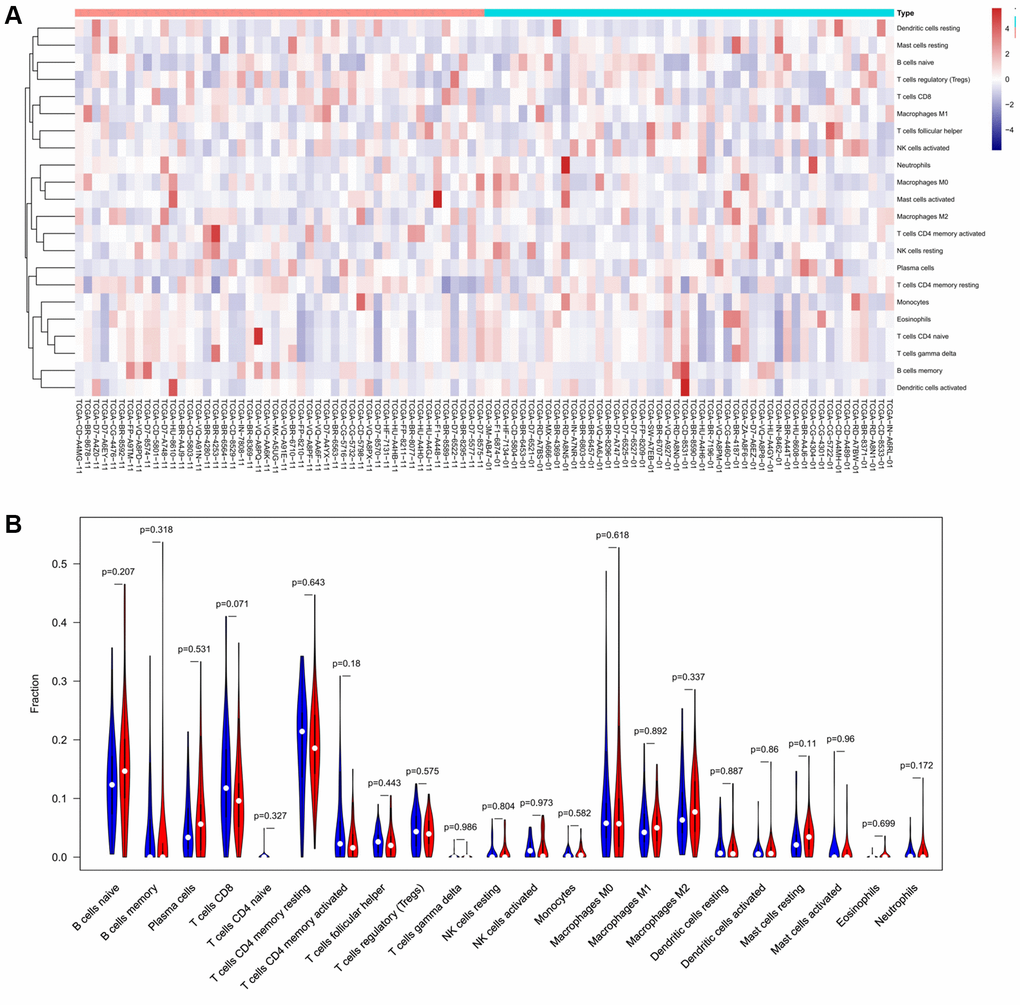
Figure 6.The distinct compositions of 22 TIICs in the high- and low-MAP1LC3C expression groups are shown using (A) heatmap and (B) violin plot and analyzed with CIBERSORT.
Figure 6 — Identification and validation of prognostic autophagy-related genes associated with immune microenvironment in human gastric cancer | Aging