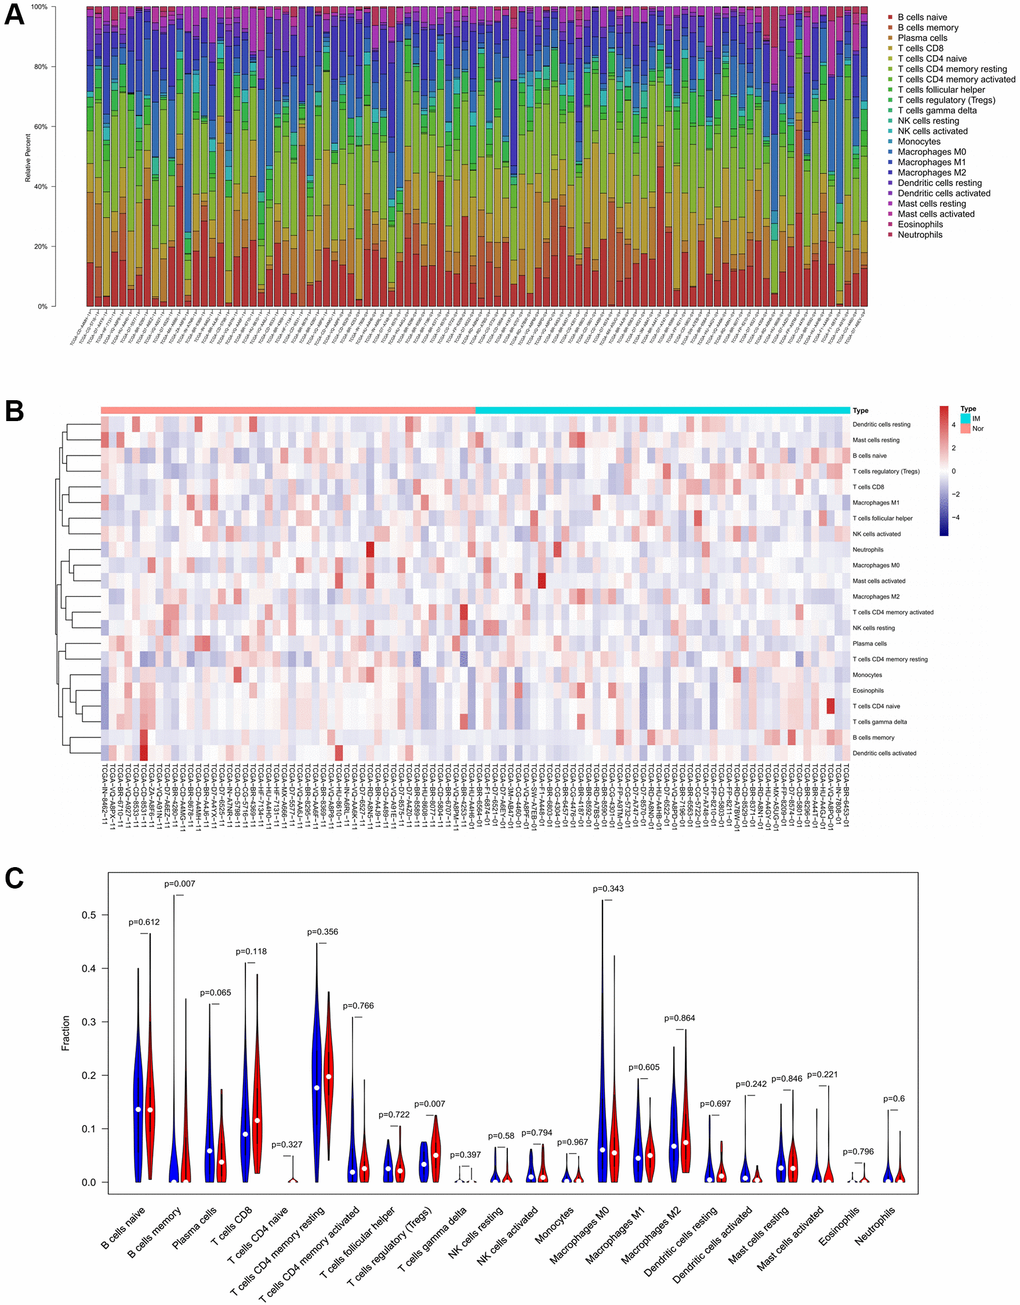
Figure 4.Composition of 22 TIICs in the TCGA cohort with CIBERSORT p < 0.05 for all qualified samples. (A) Fractions of 22 immune cells in qualified tumor samples (n = 96) in the TCGA. (B and C) Heatmap and violin plot comparing the immune cells between high- and low-CXCR4 expression groups.