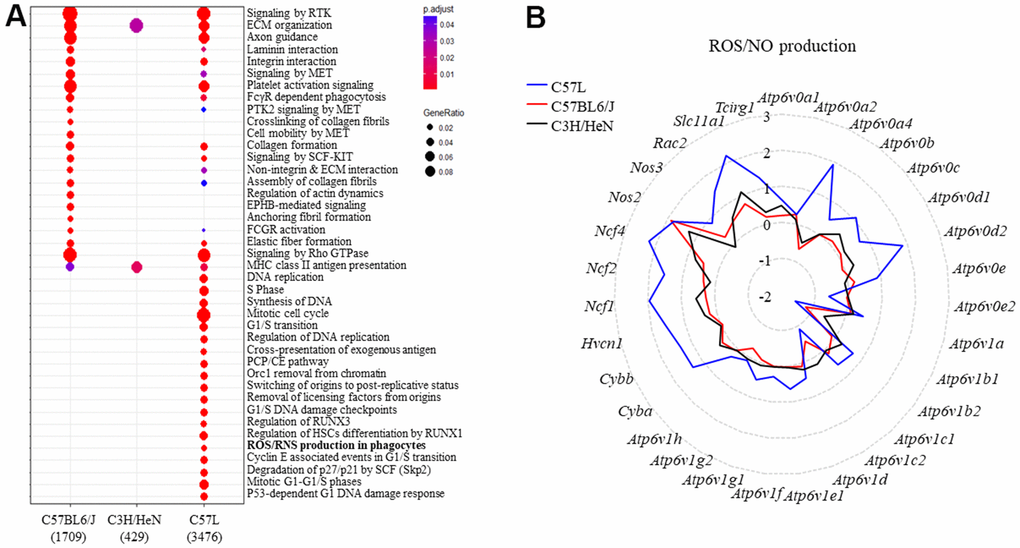
Figure 3.Identifying the genes belonging to ROS and NO production and the types of inflammatory cells in mouse lungs after thoracic radiation. (A) Reactome enrichment analysis of differentially expressed genes in the lungs of each strain (irradiated: unirradiated) at 15 weeks after irradiation. (B) The expression of genes in the ROS and NO production pathway were compared between the three strains (irradiated: unirradiated). The y-axis corresponds to the mean fold-change of each gene comparing irradiated to unirradiated within a strain (at 15 weeks after irradiation).