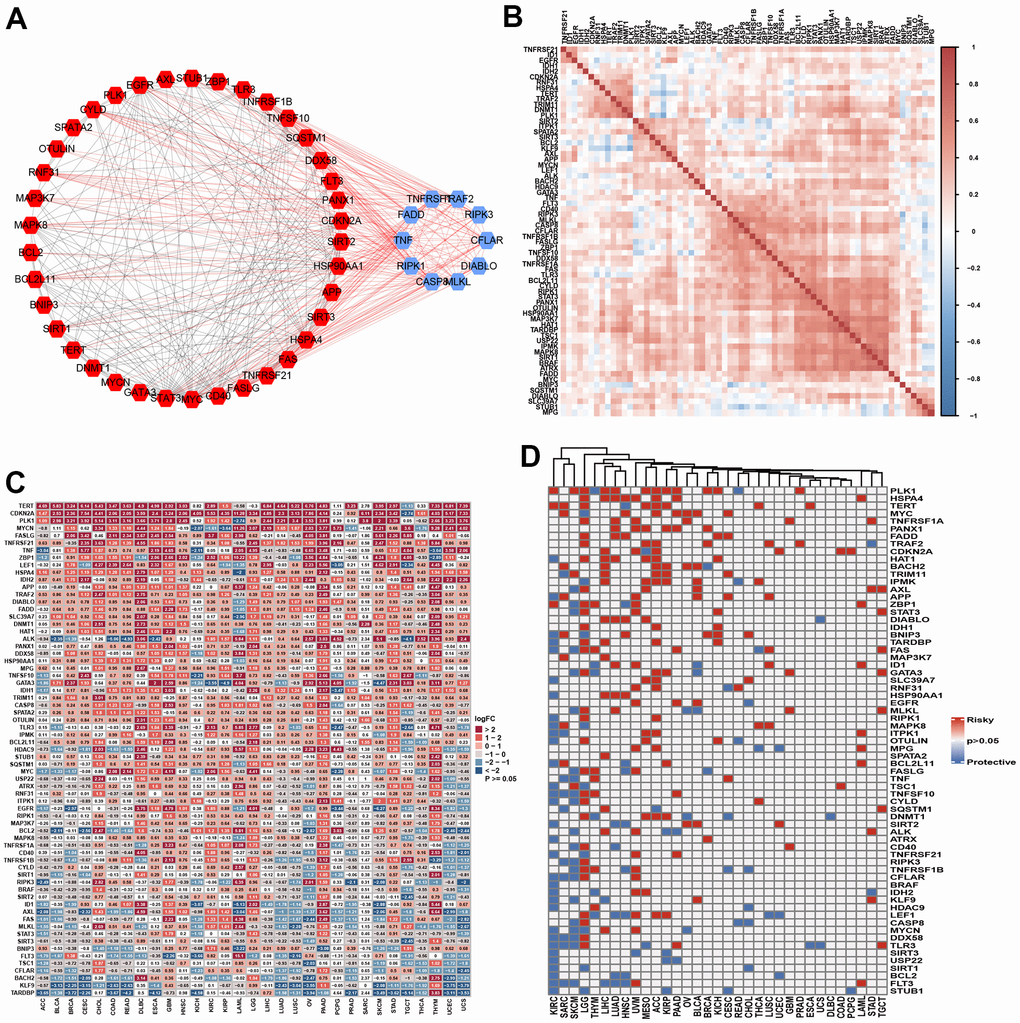
Figure 2.The landscape of necroptosis regulators. (A) Protein-protein interaction among necroptosis regulators (Blue: Top 10 hub genes; Red: non-hub genes). (B) Heatmap showed the expression profiling of necroptosis regulators between tumors and normal samples. (C) Heatmap indicated the correlations among necroptosis regulators in pan-cancer. (D) The prognosis role of necroptosis regulators in pan-cancer using log-rank method.