Submit an Article
Navigate
Home
Editorial Board
Editorial Policies
Current Volume
Archive
Scientific Integrity
Publication Ethics Statements
Interviews with Outstanding Authors
Newsroom
Sponsored Conferences
Podcast
Contact
Special Collections
Submit an Article
Online ISSN: 1945-4589
Research Paper
|
Volume 15, Issue 6
|
pp. 1878–1889
A multi-omics approach based on
1
H-NMR metabonomics combined with target protein analysis to reveal the mechanism of RIAISs on cervical carcinoma patients
Back to article
Figure 3
(3 of 7)
−
100%
+
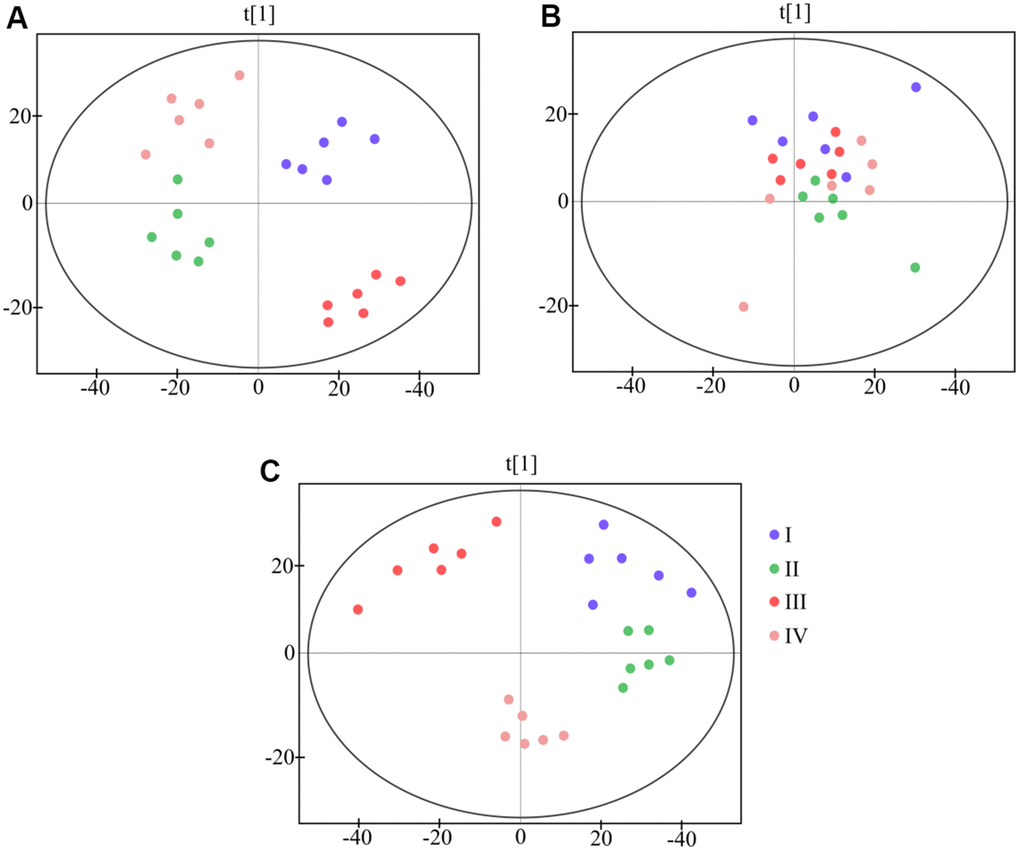
Figure 3.
PCA scores plot based on
1
H NMR spectra of different sample from four groups.
(
A
) plasma (
B
) urine (
C
) feces.