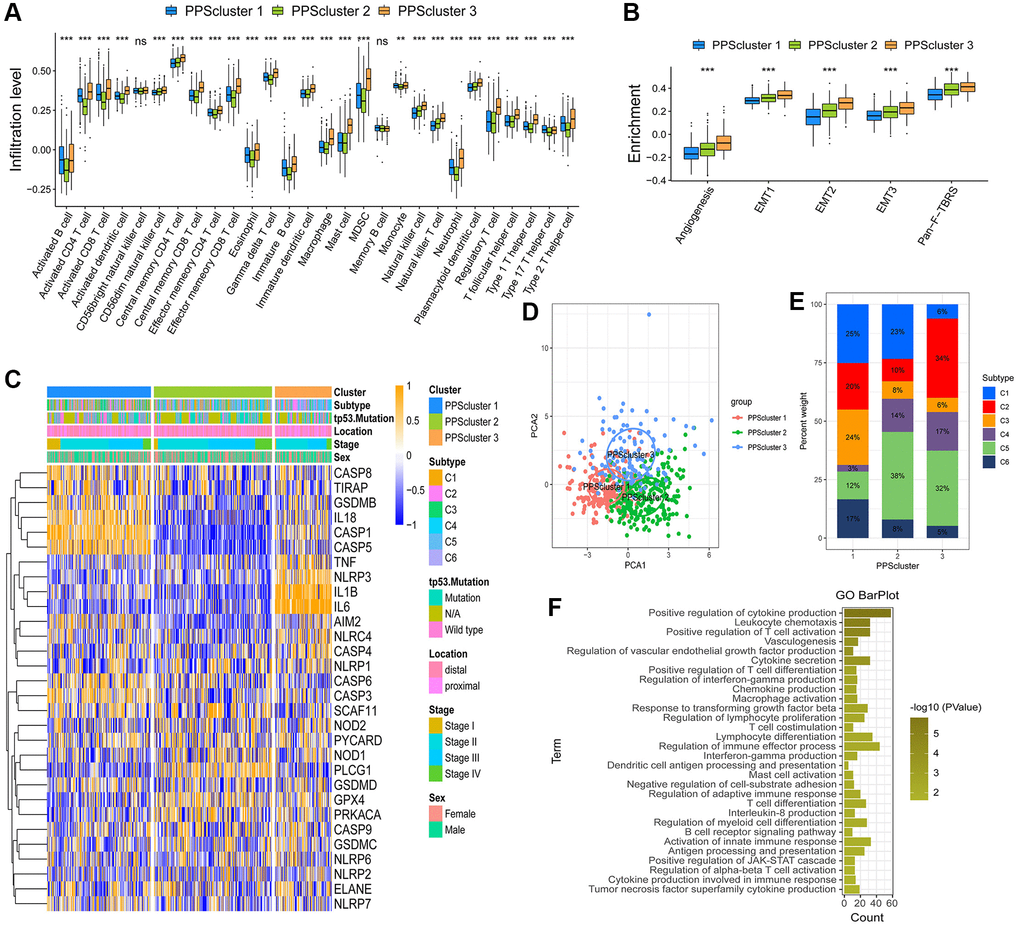
Figure 3.TME cell infiltration characteristics in distinct pyroptosis patterns. (A) The abundance of each TME infiltrating cell in three pyroptosis patterns (*P < 0.05; **P < 0.01; ***P < 0.001). (B) Differences in stroma-activated pathways in three pyroptosis patterns (*P < 0.05; **P < 0.01; ***P < 0.001). (C) Unsupervised clustering of 30 PRGs in the GSE39582 cohort. Clinicopathological information including tumor subtype, tp53 mutation, tumor location, tumor stage, and gender as well as the pyroptosis cluster, were shown in annotations above. Orange represented the high expression of genes and blue represented the low expression. (D) Principal component analysis of the transcriptome maps of the three pyroptosis patterns showed that there were significant differences among them. (E) The proportion of six molecular subtypes in GSE39582 cohort among three pyroptosis patterns. (F) The gene ontology enrichment analysis functionally annotates DEGs related to the pyroptosis patterns.