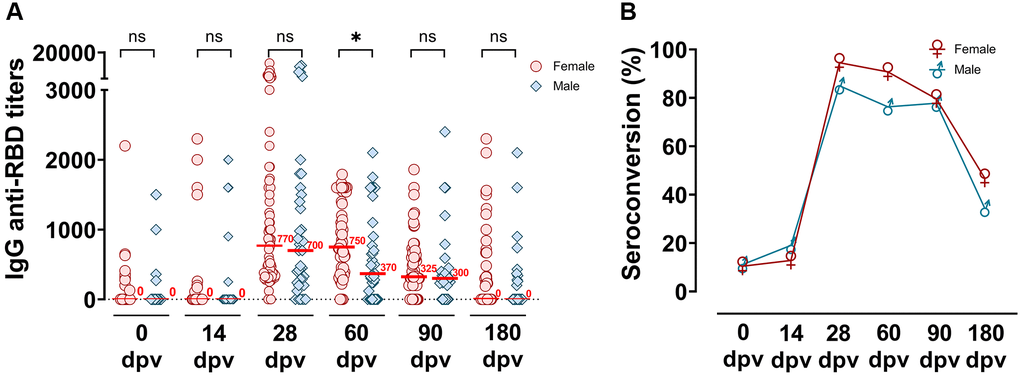
Figure 3.Distribution of IgG anti-RBD titers measured up to 180 dpv differentiated by gender groups. (A) Specific SARS-CoV-2 anti-RBD antibody titers were analyzed according to male or female gender groups, before and at different times post-vaccination (0, 14, 28, 60, 90 and 180 dpv) by ELISA. Horizontal red lines represent the median. Statistical analyses were performed with Mann-Withney test. *p < 0.05. (B) Seroconversion of IgG anti-RBD among the time post-vaccination in female and male groups.