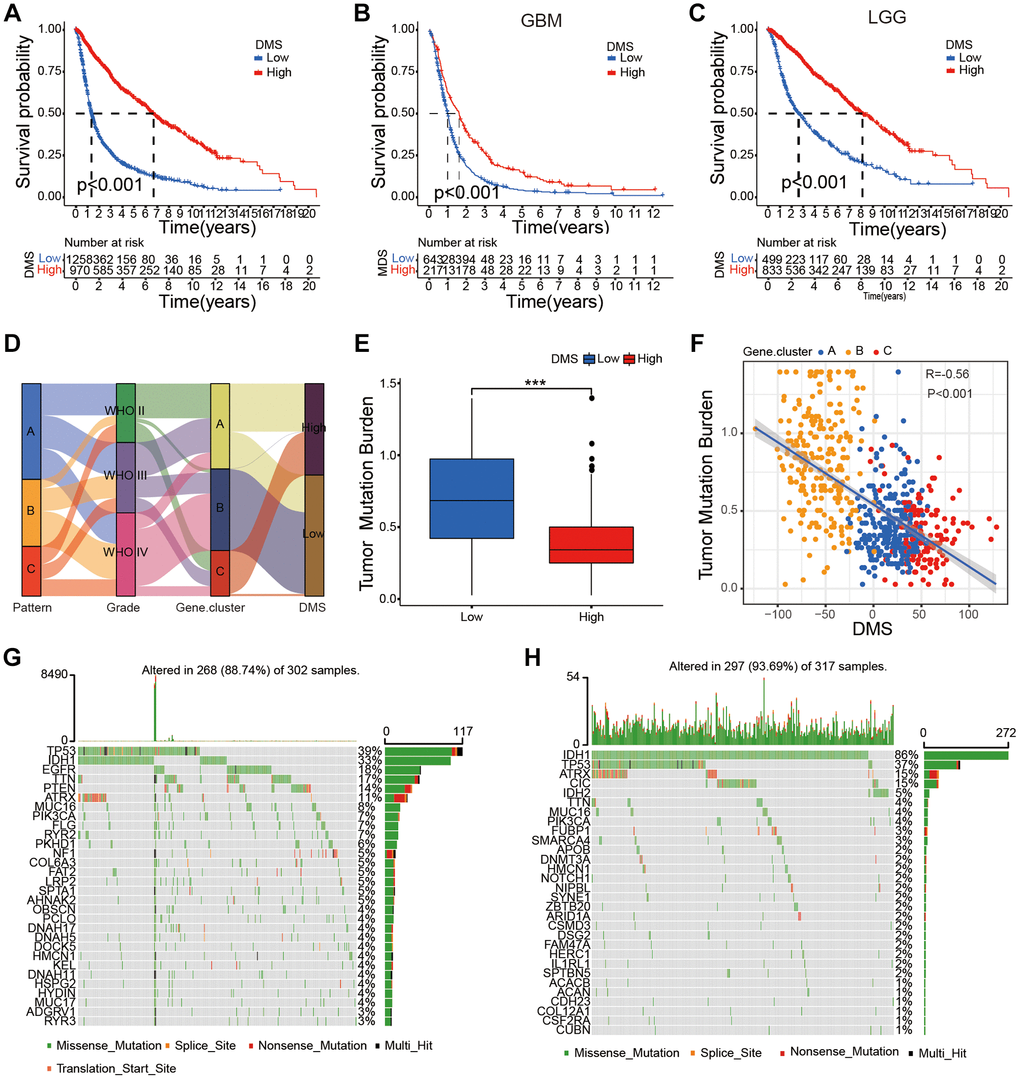
Figure 5.Survival characteristics of glioma patients based on DMS and the relationship between DMS and tumor somatic mutation. (A–C) Survival analyses with the OS rates for the low DMS and high DMS groups among all glioma (A), GBM (B) and LGG (C) samples patients based on gather glioma cohorts, P < 0.001. (D) Sankey diagram shows the association between DNA methylation regulator patterns, glioma grades, DNA methylation-related gene cluster, and DMS groups. (E) Differences in DMS between patients with high and low TMB, P < 0.001. (F) Scatter plot shows the relationship between DMS and TMB in the glioma samples (R = 0.56; P < 0.001). (G–H) Waterfall plot shows tumor somatic mutations in high (G) and low (H) DMS subgroups. Note: ns P > 0.05; *P < 0.05; **P < 0.01; ***P < 0.001.