Submit an Article
Navigate
Home
Editorial Board
Editorial Policies
Current Volume
Archive
Scientific Integrity
Publication Ethics Statements
Interviews with Outstanding Authors
Newsroom
Sponsored Conferences
Podcast
Contact
Special Collections
Submit an Article
Online ISSN: 1945-4589
Research Paper
|
Volume 14, Issue 18
|
pp. 7455–7469
Low-intensity focused ultrasound attenuates early traumatic brain injury by OX-A/NF-κB/NLRP3 signaling pathway
Back to article
Figure 5
(5 of 7)
−
100%
+
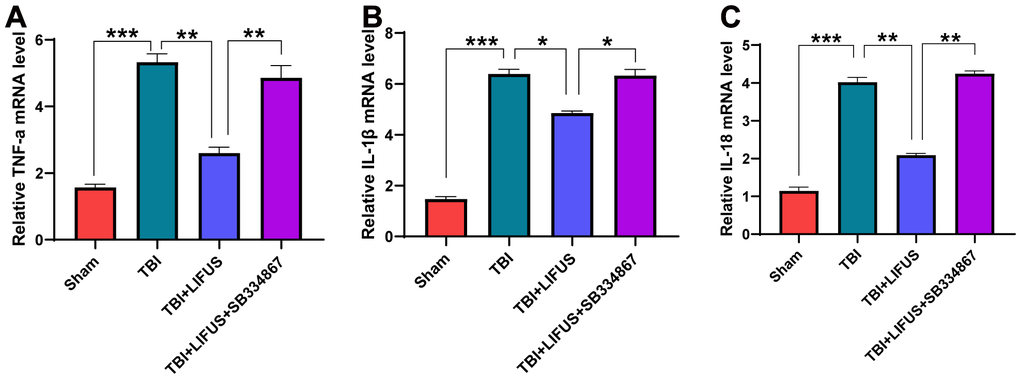
Figure 5.
Relative mRNA levels.
(
A
) tumor necrosis factor-a (TNF-a), (
B
) interleukin-1β (IL-1β), (
C
) interleukin-18 (IL-18). Results are expressed as mean ± standard deviation (n=6, SD; *P < 0.05, **P <0.01, ***P < 0.001).