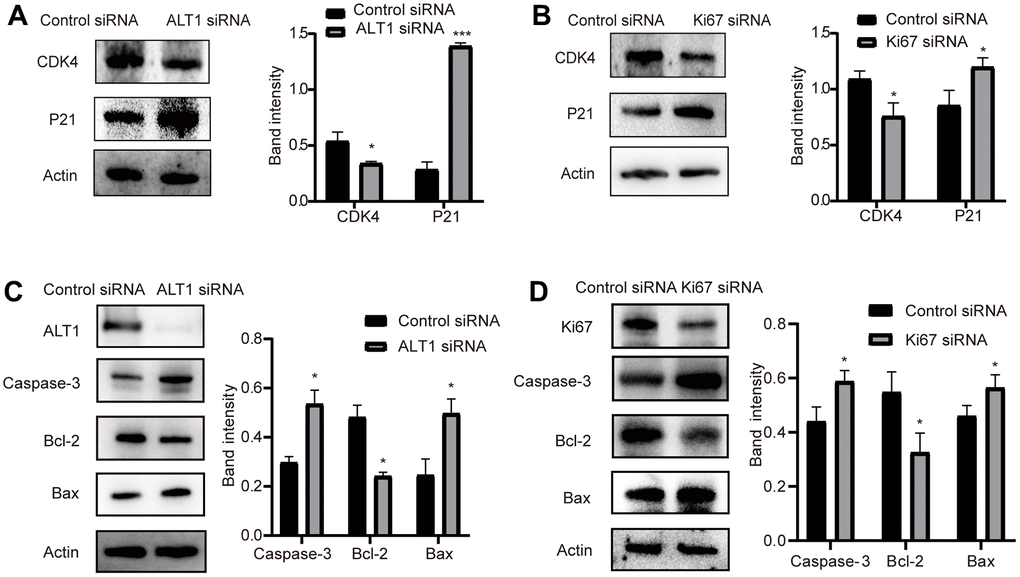
Figure 11.(A) Quantitative analysis results and representative images of the Western blot results for cleaved CDK4 and P21 in ALT1 knockdown HepG2 cells. (B) Quantitative analysis results and representative images of the Western blot results for cleaved CDK4 and P21 in Ki67 knockdown HepG2 cells. (C) Quantitative analysis results and representative images of the Western blot results for cleaved caspase-3, Bax, and Bcl-2 in ALT1 knockdown HepG2 cells. (D) Quantitative analysis results and representative images of the Western blot results for cleaved caspase-3, Bax, and Bcl-2 in Ki67 knockdown HepG2 cells.