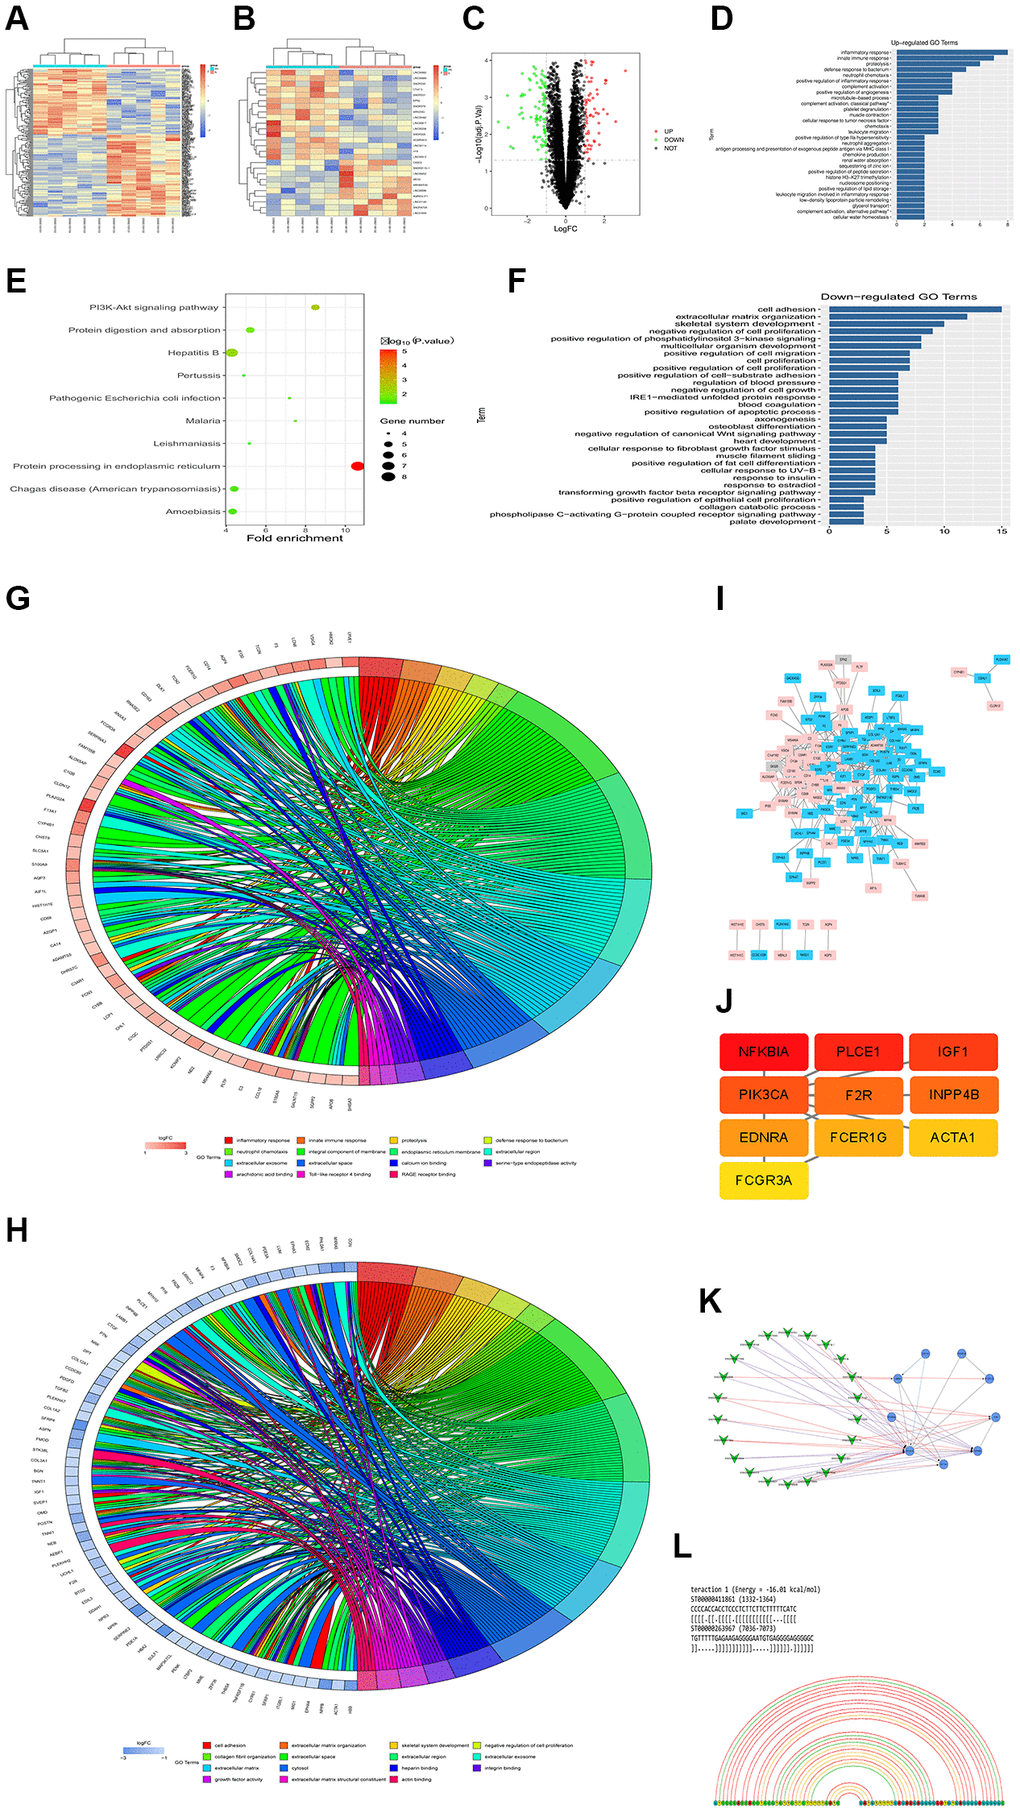
Figure 3.Overview of lncRNAH19 and PI3KCA expression in different DCM datasets. GSE101585, GSE26887 and GSE124405 were selected and downloaded from GEO database to identify the DEGs between DCM tissues and corresponding controls. (A and B) The heatmaps were screened out to illustrate the DEGs in DCM and corresponding controls using 124405 and GSE26887. (C) A volcano map was plotted to illustrate the DEGs using GSE101585. (D) GO enrichment analysis of abnormal regulation DEGs using GSE101585. (E) KEGG enrichment analysis of abnormal regulation DEGs using GSE101585. (F) GO biological processes analysis for the DEGs from GSE124401. (G and H) GO and KEGG enrichment analysis of abnormal regulation DEGs using GSE124405. (I) The PPI network of DEGs using GSE26887. (J) The top 10 hub genes in the PPI network were screened by Cytoscape plugin CytoHubba. (K) The Cytoscape co-expression analysis between differently expressed mRNAs and lncRNAs. (L) lncRNA-RNA interaction prediction.