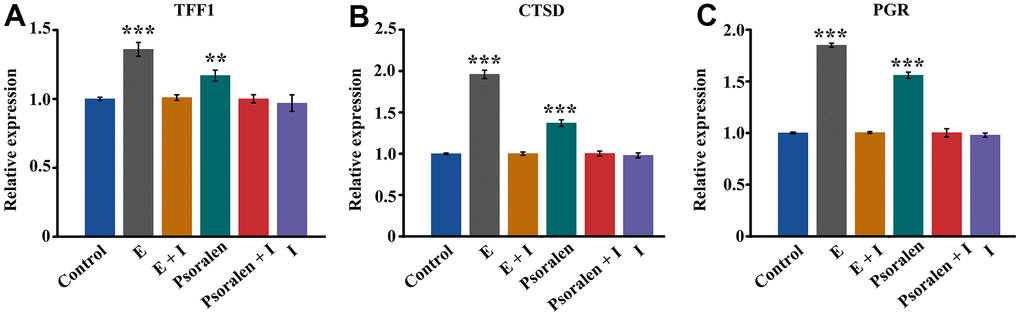
Figure 2.Expression of estrogen receptor target genes TFF1, CTSD, and PGR. E represents estrogen and I represents estrogen receptor antagonist. (A) Expression of TFF1 gene, (B) Expression of CTSD gene, (C) Expression of PGR gene. ** represents P < 0.01, *** represents P < 0.001 compared to control group.