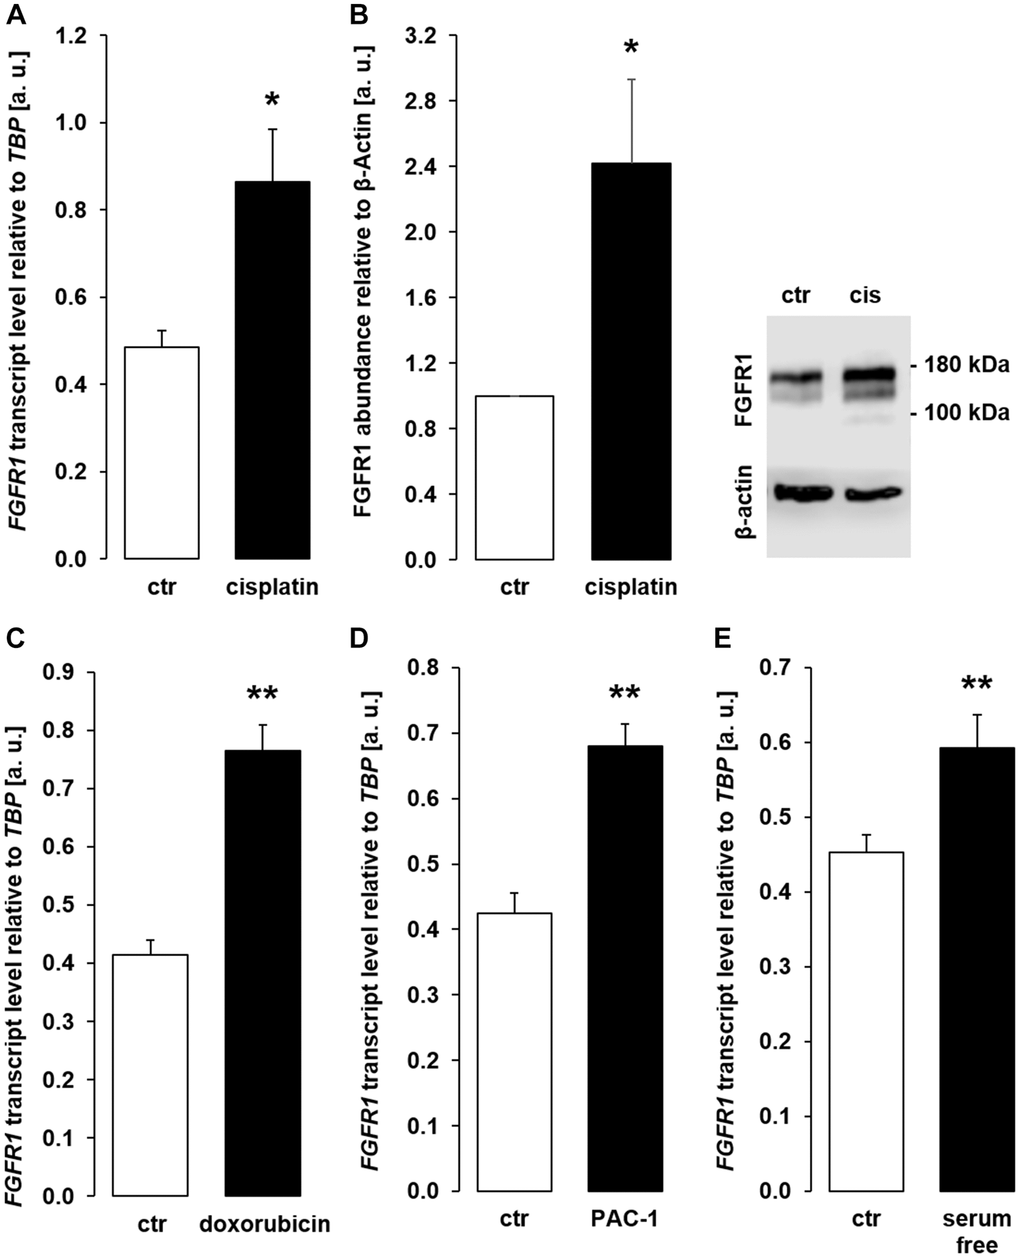
Figure 9.Cisplatin, doxorubicin, PAC-1, and serum depletion up-regulate FGFR1 in MDCK cells. (A) Arithmetic mean ± SEM of FGFR1 mRNA levels relative to TBP in MDCK cells treated with or without 10 μM cisplatin for 24 h (n = 5, paired t-test). (B) Left panel: Arithmetic mean ± SEM of FGFR1 protein abundance normalized to the abundance of β-actin in MDCK cells following treatment with or without 10 μM cisplatin for 24 h (n = 7, one-sample t-test). Right panel: Original Western Blot demonstrating the abundance of FGFR1 in MDCK cells treated with (cis) or without (ctr) 10 μM cisplatin for 24 h. (C) Arithmetic mean ± SEM of FGFR1 transcript levels relative to TBP in MDCK cells treated with or without 300 nM doxorubicin for 24 h (n = 4, paired t-test). (D) Arithmetic mean ± SEM of FGFR1 transcript level relative to TBP in MDCK cells treated with or without 10 μM PAC-1 for 24 h (n = 5, paired t-test). (E) Arithmetic mean ± SEM of FGFR1 transcripts relative to TBP in MDCK cells incubated without or with 5 % FBS in culture medium for 24 h (n = 5, paired t-test). *p < 0.05, **p < 0.01 indicate significant difference from vehicle control; Abbreviations: a. u.: arbitrary units; cis cisplatin; ctr: control.