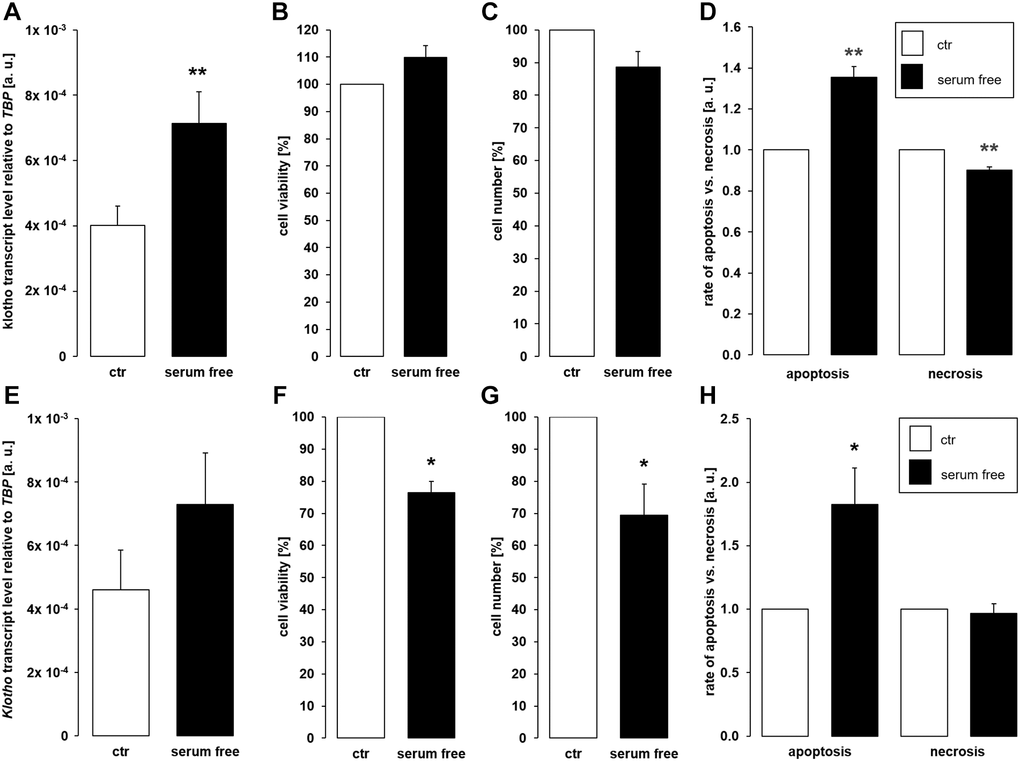
Figure 5.Serum deprivation up-regulates αklotho expression in MDCK cells. (A) Arithmetic mean ± SEM of αklotho transcript levels relative to TBP in MDCK cells incubated for 24 h with or without 5% fetal bovine serum (FBS; n = 5; paired t-test). (B, C) Arithmetic mean ± SEM of MDCK cell viability (B) or number (C) upon incubation with or without 5% FBS for 24 h (B: n = 4, one-sample t-test; C: n = 6, one-sample t-test). (D) Rate of apoptosis and necrosis of MDCK cells cultured with or without 5% FBS for 24 h (n = 6, one-sample t test). (E) Arithmetic mean ± SEM of αklotho transcript levels relative to TBP in NRK-52E cells incubated for 24 h with or without 5% newborn calf serum (NBCS) (n = 8, paired t-test). (F, G) Arithmetic mean ± SEM of NRK-52E cell viability (F) or number (G) upon incubation with or without 5% NBCS for 24 h (F: n = 5, one-sample t-test; G: n = 4, one-sample t-test). (H) Rate of apoptotis and necrosis of NRK-52E cells cultured with or without 5% NBCS for 24 h (n = 5, one-sample Wilcoxon test). *p < 0.05, **p < 0.01 indicates significant difference from control cells; Abbreviations: a. u.: arbitrary units; ctr: control.