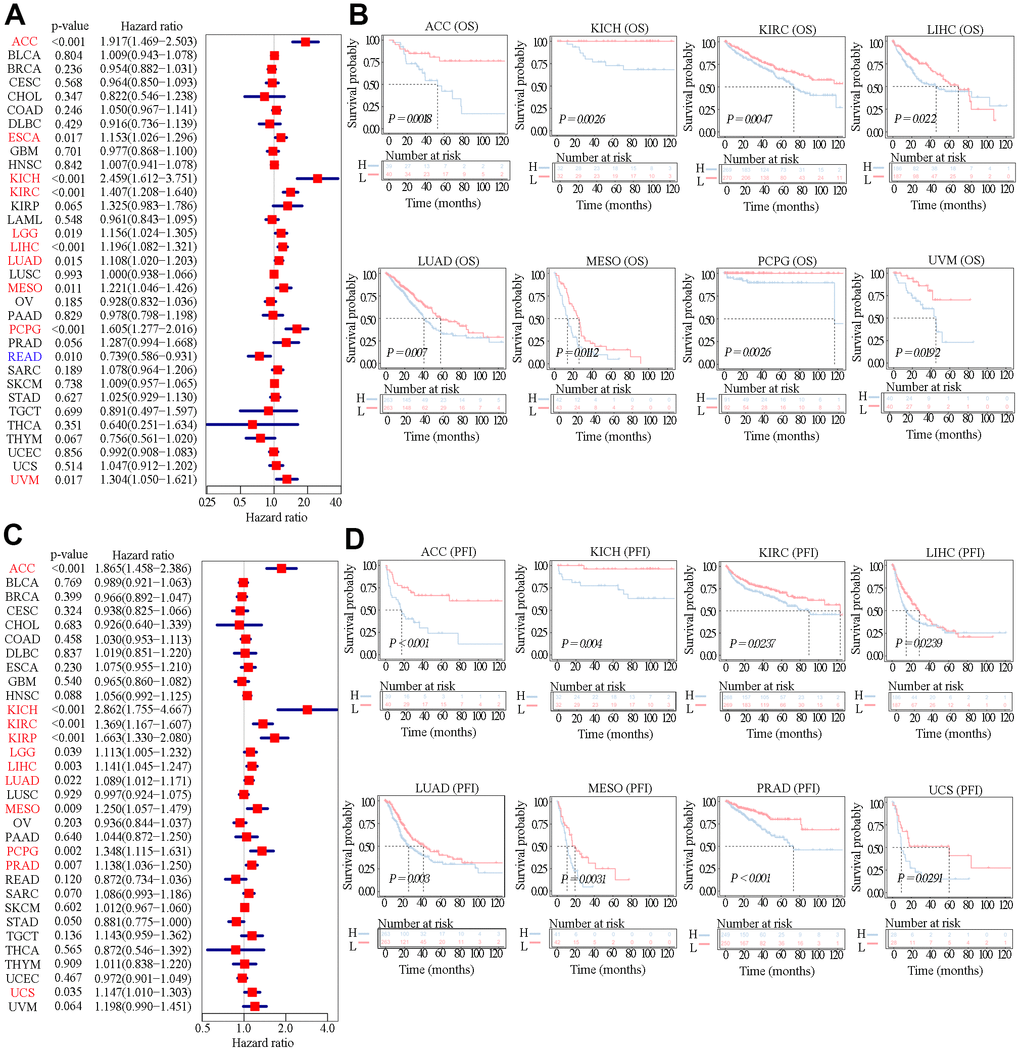
Figure 4.Relationship between SAAL1 expression and OS and PFI. (A) Forest plot of hazard ratios for OS (univariate survival analysis) in various cancer types. (B) Kaplan-Meier curves for OS derived from patients stratified according to SAAL1 gene expression. (C) Forest plot of hazard ratios for PFI. (D) Kaplan-Meier curves for PFI.