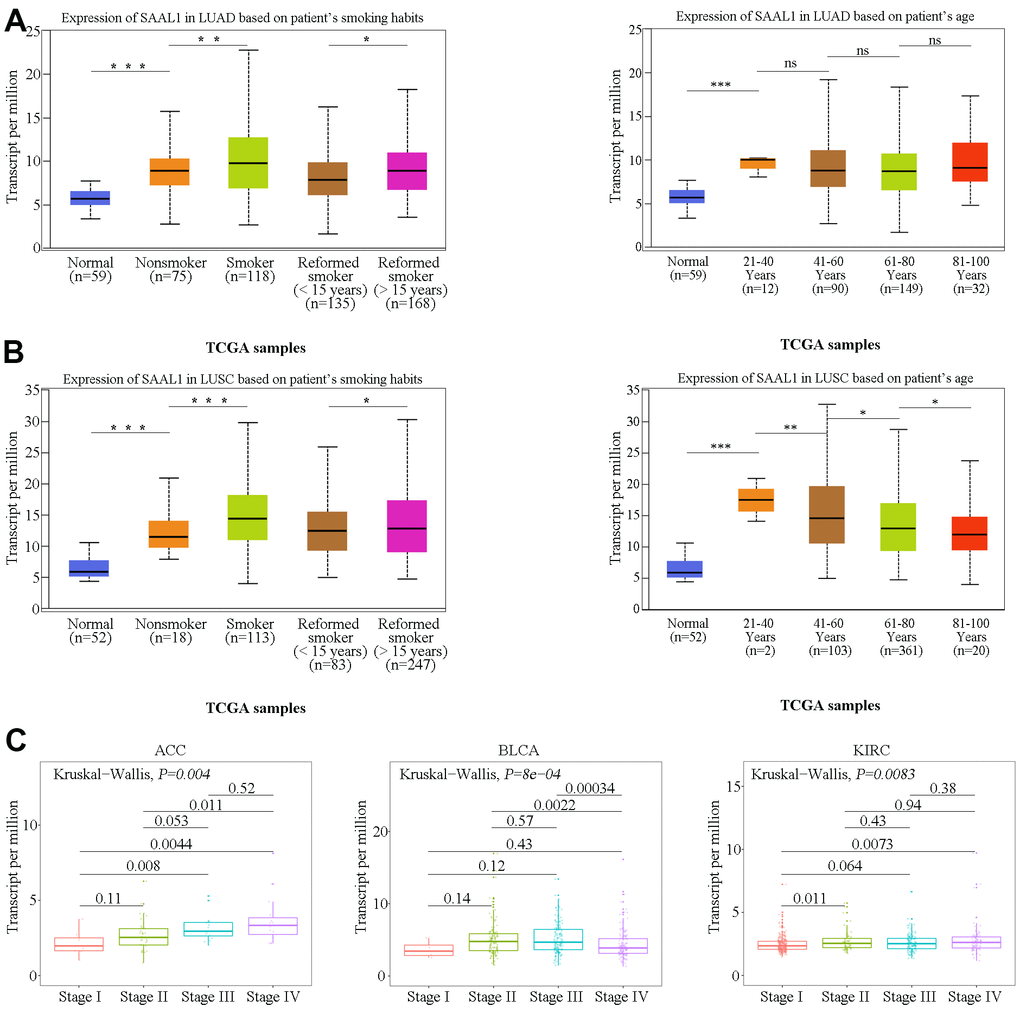
Figure 3.Correlation analysis of SAAL1 expression and clinical parameters. SAAL1 expression in (A) LUAD and (B) LUSC stratified according to patients’ smoking history and age. (C) SAAL1 expression as a function of tumor stage. *P<0.05; **P<0.01; ***P<0.001; ns, not significant.