Submit an Article
Navigate
Home
Editorial Board
Editorial Policies
Current Volume
Archive
Scientific Integrity
Publication Ethics Statements
Interviews with Outstanding Authors
Newsroom
Sponsored Conferences
Podcast
Contact
Special Collections
Submit an Article
Online ISSN: 1945-4589
Research Paper
|
Volume 14, Issue 15
|
pp. 6299–6315
Establishing and validating an ADCP-related prognostic signature in pancreatic ductal adenocarcinoma
Back to article
Figure 2
(2 of 10)
−
100%
+
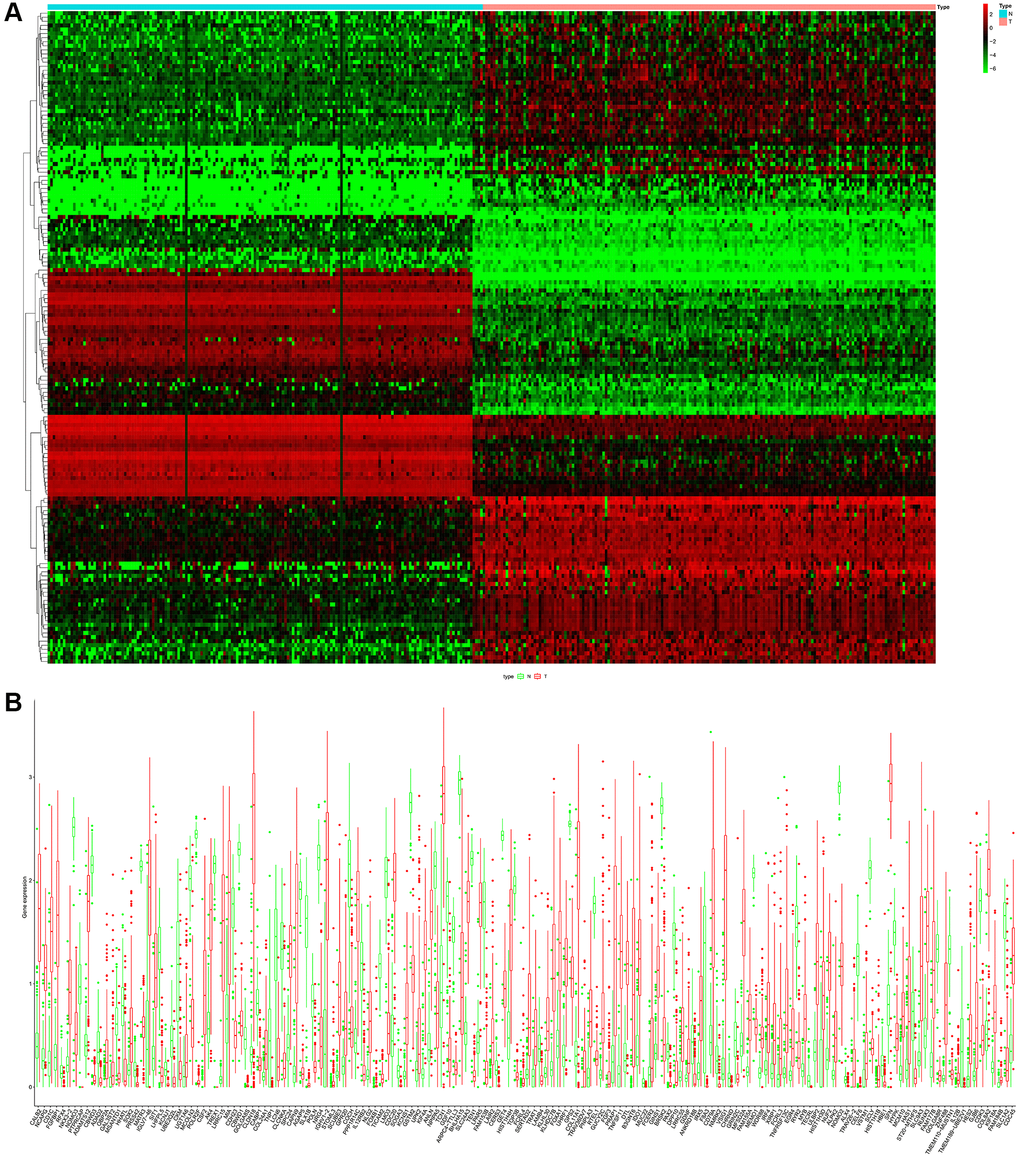
Figure 2.
(
A
) Heatmap of the differential ARGs in the combination of GTEx data and TCGA-PAAD data. (
B
) Barplot of each differential ARGs between normal samples (green) and tumor samples (red).