Submit an Article
Navigate
Home
Editorial Board
Editorial Policies
Current Volume
Archive
Scientific Integrity
Publication Ethics Statements
Interviews with Outstanding Authors
Newsroom
Sponsored Conferences
Podcast
Contact
Special Collections
Submit an Article
Online ISSN: 1945-4589
Research Paper
|
Volume 14, Issue 16
|
pp. 6415–6426
Heritability of R2* iron in the basal ganglia and cortex
Back to article
Figure 2
(2 of 2)
−
100%
+
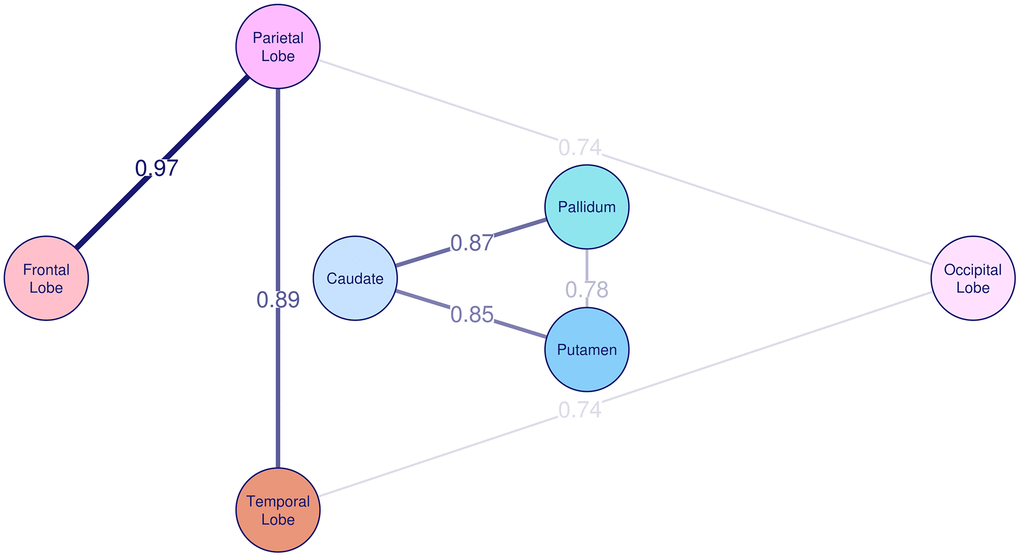
Figure 2.
Genetic correlation of R2* among basal ganglia and cortex.
The genetic correlation coefficient r
g
is plotted on the lines and also represented by the thickness of the lines between the brain regions.