Submit an Article
Navigate
Home
Editorial Board
Editorial Policies
Current Volume
Archive
Scientific Integrity
Publication Ethics Statements
Interviews with Outstanding Authors
Newsroom
Sponsored Conferences
Podcast
Contact
Special Collections
Submit an Article
Online ISSN: 1945-4589
Research Paper
|
Volume 14, Issue 14
|
pp. 5908–5924
microRNA-497 prevents pancreatic cancer stem cell gemcitabine resistance, migration, and invasion by directly targeting nuclear factor kappa B 1
Back to article
Figure 1
(1 of 10)
−
100%
+
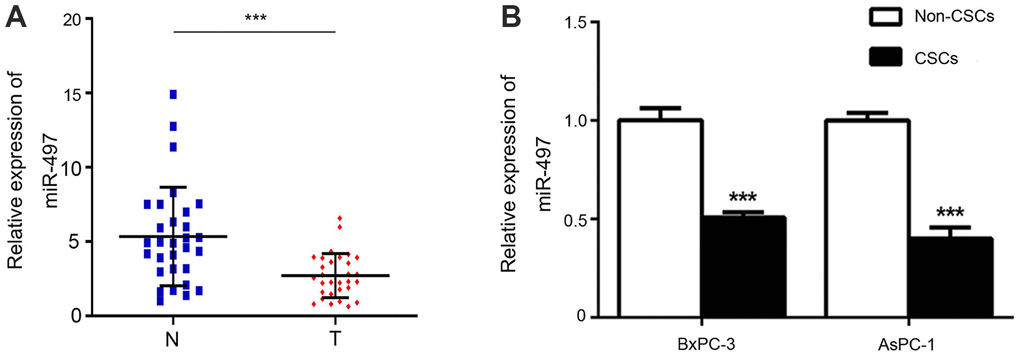
Figure 1.
Expression of miR-497.
The levels of miR-497 in tissues (
A
) and cells (
B
) were determined by RT–PCR. N, normal; T, tumor; CSCs, cancer stem cells. ***p < 0.001, as compared with non-CSCs.