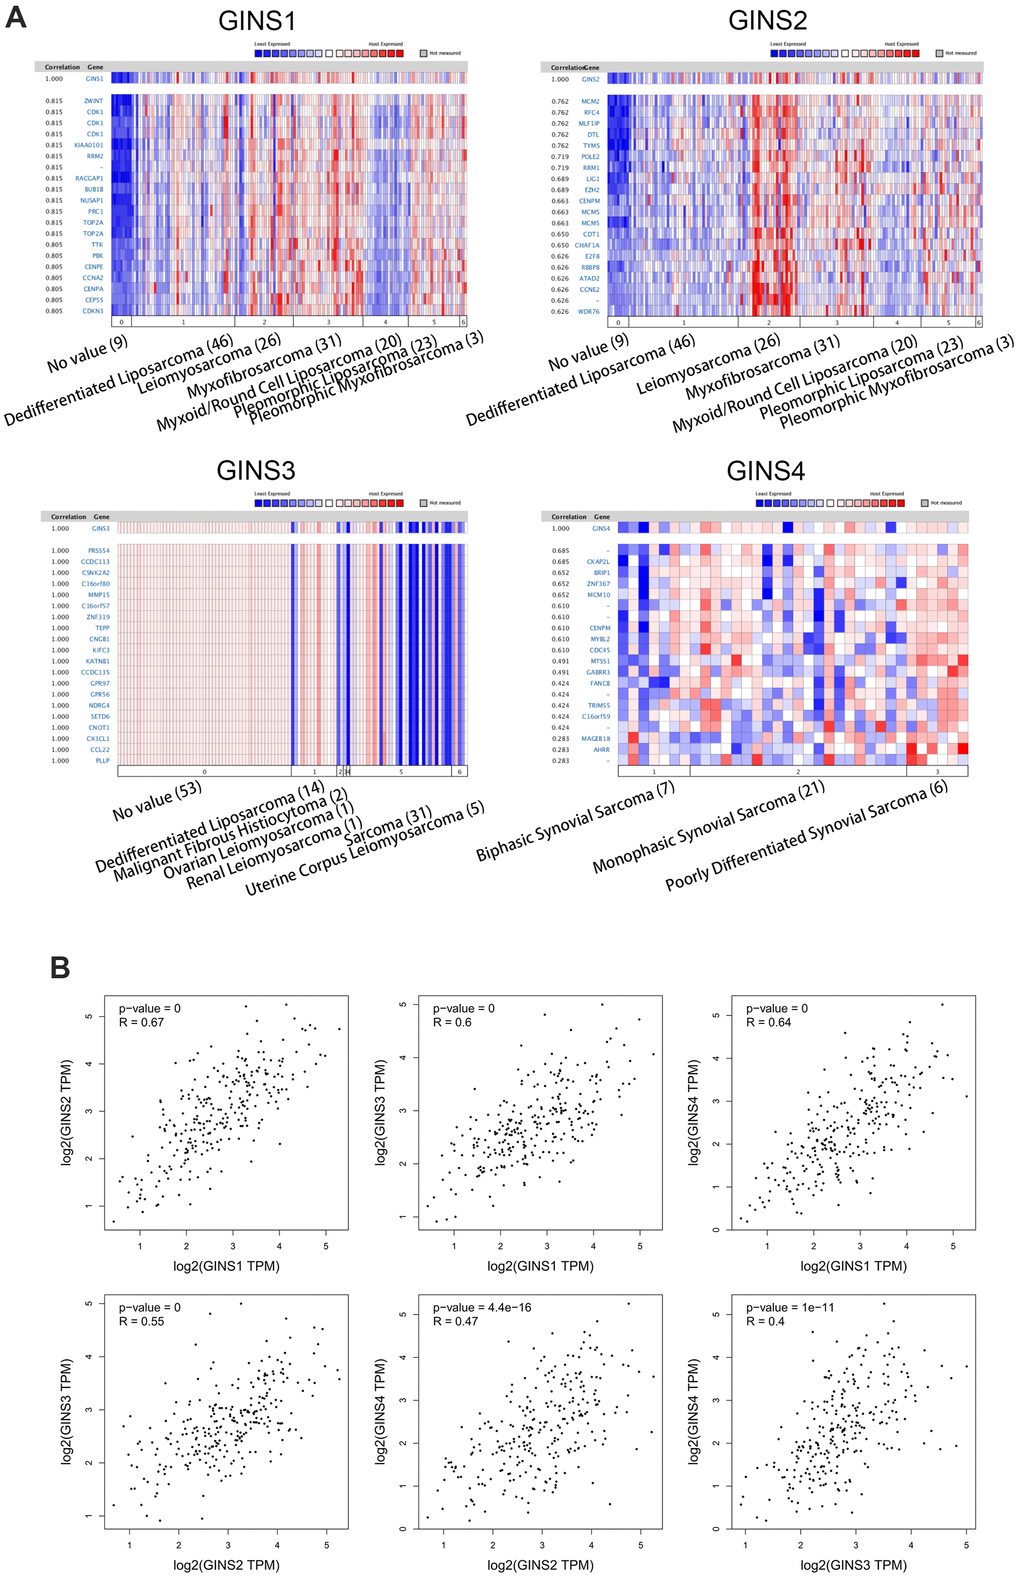
Figure 5.Genes co-expressed with the GINS gene family in human sarcoma tissues. (A) Co-expressed genes of the GINS gene family in sarcomas. (B) Correlation between members of the GINS gene family in tumors analyzed by GEPIA.
Figure 5 — Combined analysis of expression, prognosis and immune infiltration of GINS family genes in human sarcoma | Aging