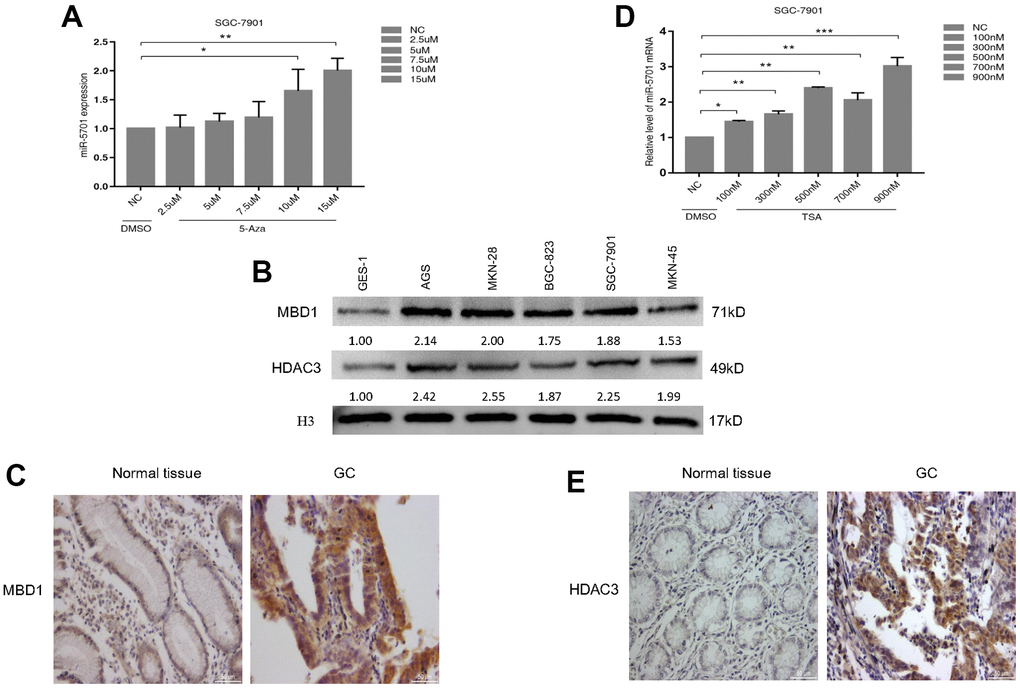
Figure 8.miR-5701 expression was regulated by MBD1 and HDAC3. (A) SGC-7901 cells were treated with 5-Aza at different concentration and miR-5701 expression was measured by qRT-PCR. (B) MBD/HDAC3 levels of several GC cell lines were measured by western blot. (C) The representative images of MBD1 in GC tissue versus normal tissue by immunohistochemistry. (D) SGC-7901 cells were treated with TSA at different concentration and miR-5701 expression was measured by qRT-PCR. (E) The representative images of HDAC3 in GC tissue versus normal tissue by immunohistochemistry.