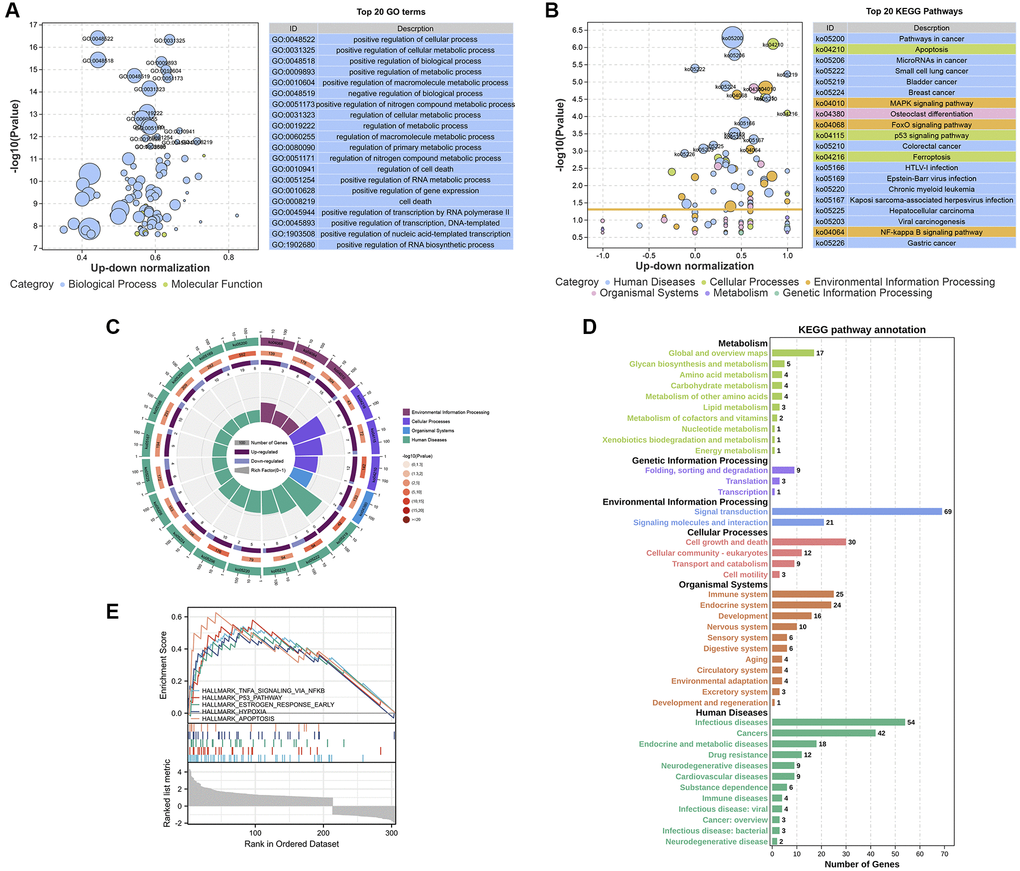
Figure 4.Enrichment analysis of the DEGs in SWT-treated MCF-7 cells. (A and B) Bubble plot showing the top 20 GO and KEGG enrichment analysis results. The larger the ordinate value in the bubble chart, the more significant the corresponding GO or KEGG result is. The abscissa represents the normalized upregulation and downregulation value (the ratio of the difference between the number of upregulated genes and the number of downregulated genes to the total number of differential genes). The higher the value is, the higher the number of upregulated genes enriched in the GO/KEGG pathway results; conversely, the lower the value is, the higher the number of downregulated genes enriched in the GO/KEGG pathway results. (C) Secondary classification of the top 20 KEGG pathways. (D) Secondary classification of all KEGG pathways. (E) GSEA of the DEGs.