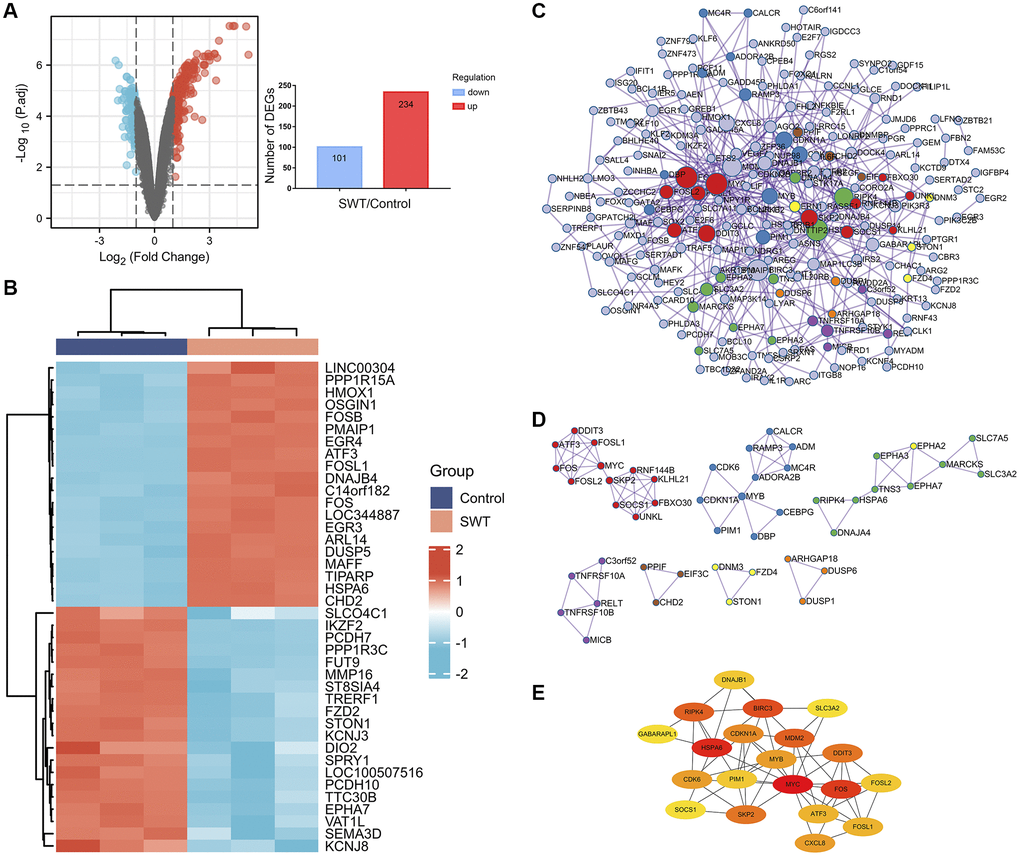
Figure 3.Differential gene expression patterns and network analysis of SWT-treated MCF7 cells. (A) Volcano plot (left) showing the gene expression patterns of SWT-treated MCF-7 samples. Red and blue represent upregulated genes (logFC ≥ 1) and downregulated genes (logFC ≤ -1), respectively, while gray indicates genes with no significant difference in expression. In addition, the respective numbers of significantly regulated genes are presented in histograms (right). (B) Heatmap analysis of the top 20 up- or downregulated DEGs. (C) PPI network analysis of DEGs. (D) MCODE module for gene clustering analysis. (E) Hub gene analysis of DEGs.