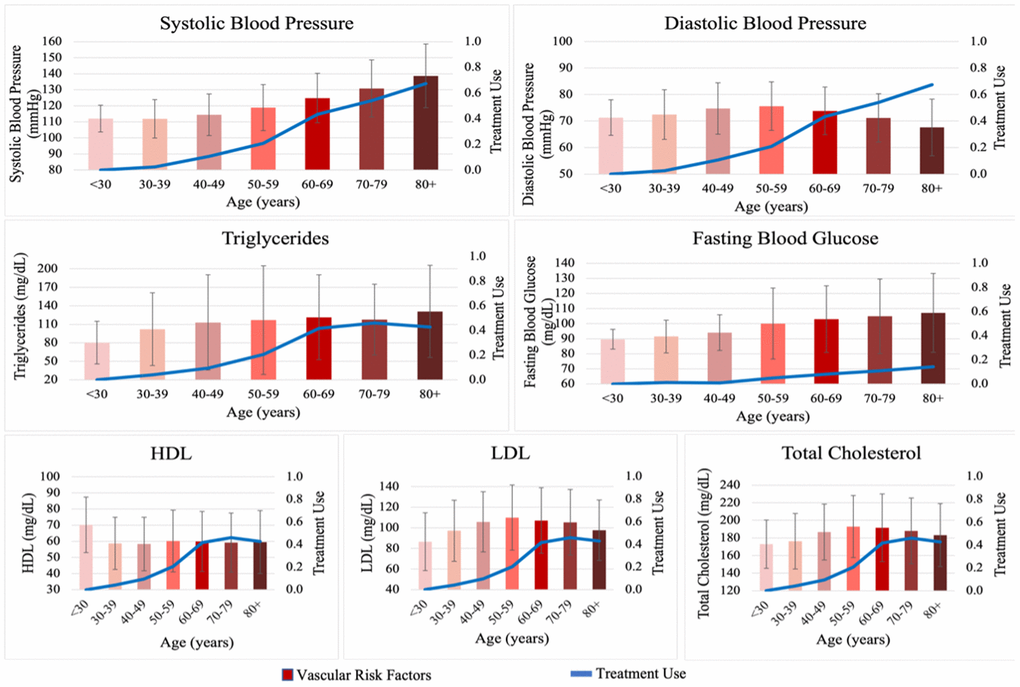
Figure 6.Levels of vascular risk factors and proportion of treatment use across age groups during the entire adult life span. Vascular risk factors and treatment use stratified in 10-years of age groups. High-Density Lipoprotein-Cholesterol (HDL-C, mg/dL), Low-Density Lipoprotein-Cholesterol (LDL-C, mg/dL), total glucose (TG, mg/dL), total cholesterol (TC, mg/dL), systolic blood pressure (SBP, mmHg), diastolic blood pressure (DBP, mmHg), fasting blood glucose (FBG, mg/dL). The red bars represent mean levels and the error bars represent standard deviation of vascular risk factors in units commonly used in clinical practice across age groups by decade, during the entire adult life span. The blue line represents the proportion of participants using medications for the respective risk factor. Notice the increasing levels of lipids and blood glucose from early to mid-adult life, followed by plateau or decrease in late life, which is also paralleled by increasing prevalence of treatment use and plateau in the elderly. On the other hand, systolic blood pressure continues to risk throughout life while diastolic blood pressure reaches a plateau and decreases in late life, reflecting widening of pulse pressure likely related to progressive arterial stiffness. Random blood glucose was used for the Original cohort.