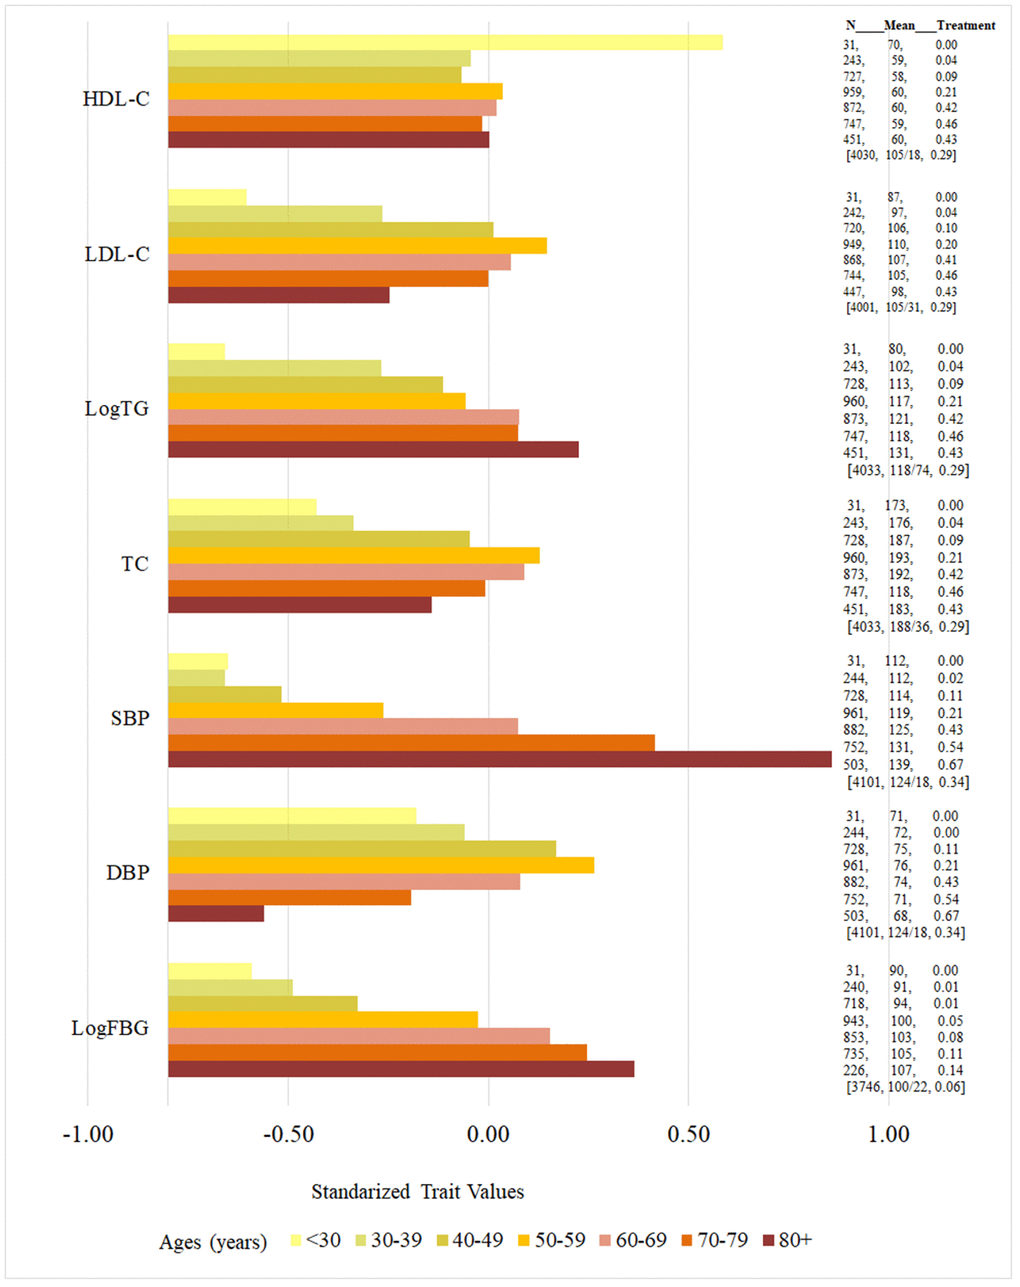
Figure 5.Age-specific vascular risk factors (standardized values) and proportion of vascular risk factor treatment use. High-Density Lipoprotein-Cholesterol (HDL-C, mg/dL), Low-Density Lipoprotein-Cholesterol (LDL-C, mg/dL), total glucose (TG, mg/dL), total cholesterol (TC, mg/dL), systolic blood pressure (SBP, mmHg), diastolic blood pressure (DBP, mmHg), fasting blood glucose (FBG, mg/dL). Horizontal color bars represent standardized values for each vascular risk factor, presented by age group in 10-year strata, from younger to older groups (top to bottom). The three columns on the right of the bars present the following data for each age group: number of individuals in each age stratum (N), mean value for each vascular risk factors in units used in clinical practice (unstandardized, middle column), and proportion of individuals using medication for the treatment of the respective risk factor (percent, third column); square brackets were used for the entire sample [n, unstandardized mean/standard deviation (SD), percent of individuals using medication]. Notice that the number of participants with each risk factor increases progressively as age group increases until middle age, where some of the risk factors plateau or decrease, which parallels an increase in the percent of individuals using medications for the treatment of the individual risk factor. However, some risk factors rise across all age groups despite medication use increases, including SBP, TG and FBG.