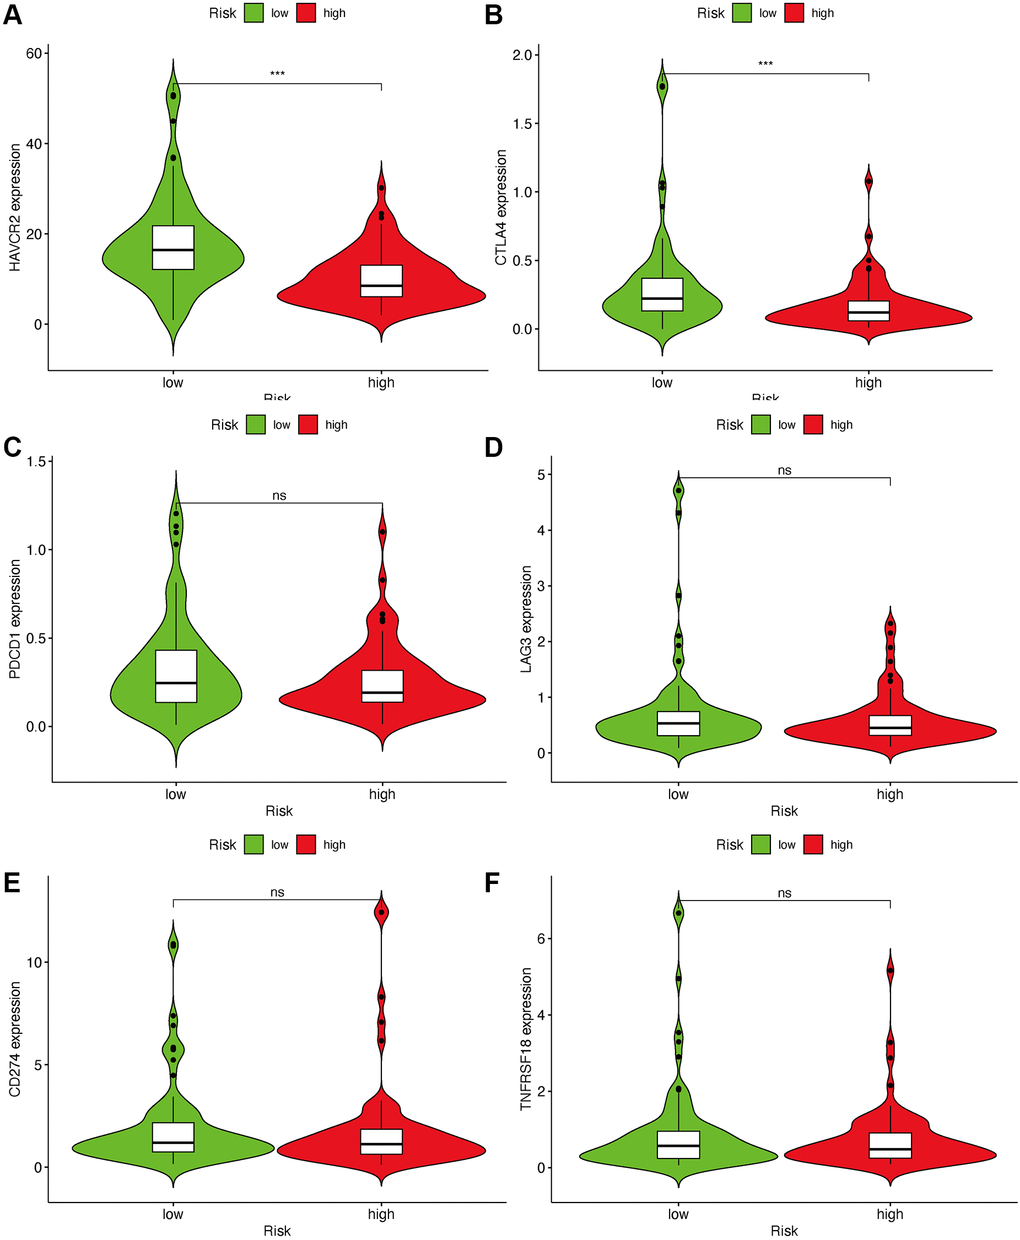
Figure 7.Estimate immunosuppressive molecules through risk assessment model. High-risk scores were associated with the expression of HAVCR2 (A) and CTLA4 (B). There was no statistical difference between the risk scores and immune-related genes, such as PDCD1 (C), LAG3 (D), CD274 (E) and TNFRSF18 (F).