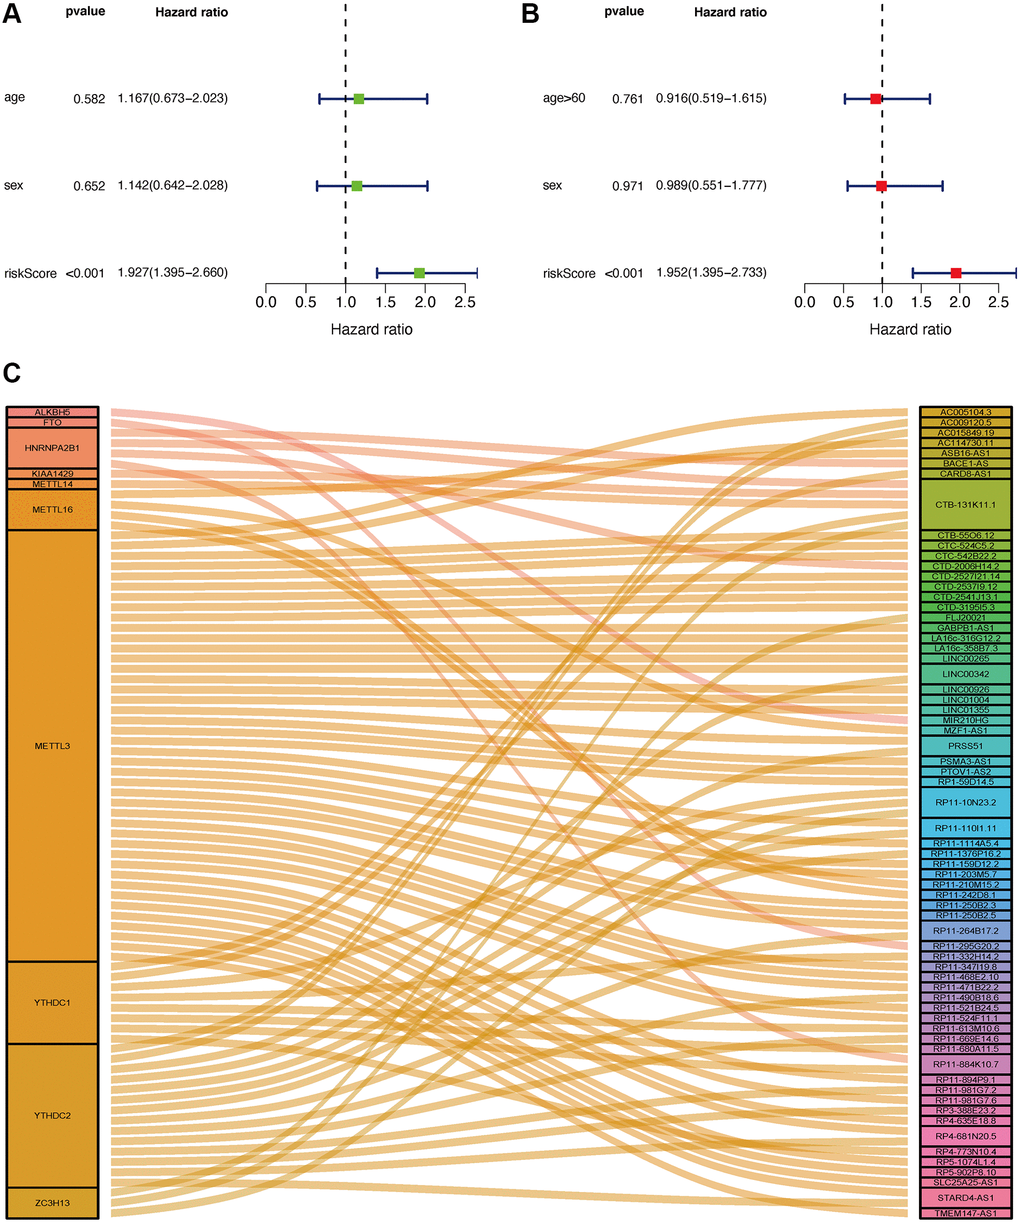
Figure 5.Application of risk assessment model in the clinical evaluation. Univariate and multivariate Cox regression analyses were carried out to analyze the clinicopathological features and shown by a forest map (A and B). Sankey Plot shows the link between m6A genes and related lncRNAs (C).