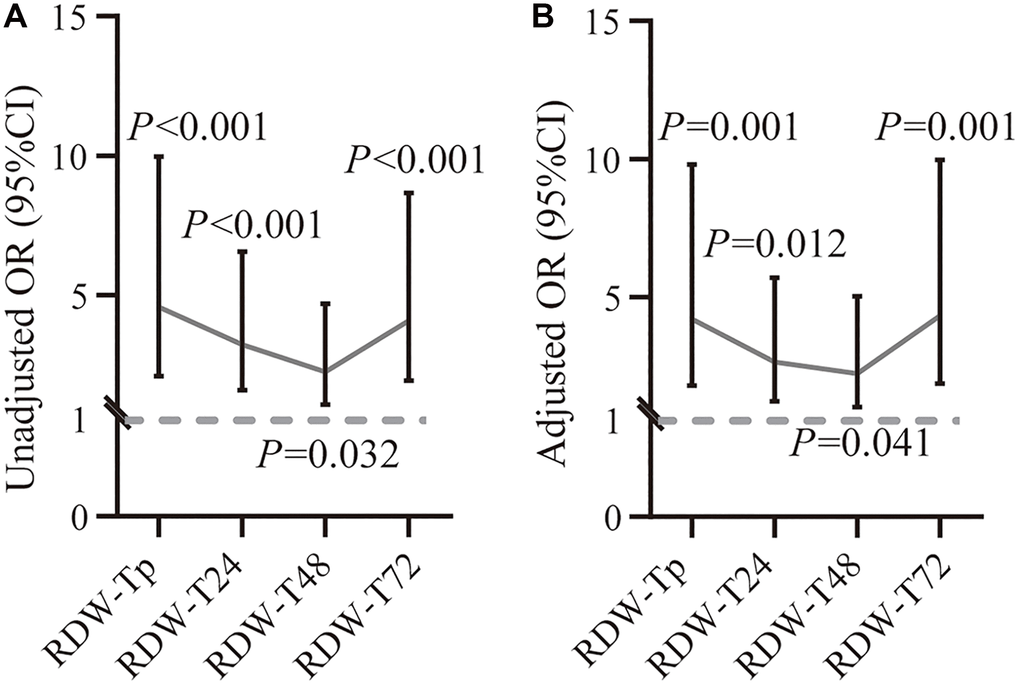
Figure 4.Associations between RDW at different time points of peripheral thrombolysis period and recurrent stroke. Correlation between RDW values and recurrent stroke before (A) and after (B) adjusting variables at different time points from prior thrombolysis to 72 h after thrombolysis. The dashed horizontal lines represent OR values and 95% CI. *P less than 0.05; **P less than 0.01; ***P less than 0.001. Abbreviations: CI: confidence interval; OR: odds ratio.