Submit an Article
Navigate
Home
Editorial Board
Editorial Policies
Current Volume
Archive
Scientific Integrity
Publication Ethics Statements
Interviews with Outstanding Authors
Newsroom
Sponsored Conferences
Podcast
Contact
Special Collections
Submit an Article
Online ISSN: 1945-4589
Research Paper
|
Volume 14, Issue 14
|
pp. 5727–5748
The therapeutic effect of Fufang Zhenshu Tiaozhi (FTZ) on osteoclastogenesis and ovariectomized-induced bone loss: evidence from network pharmacology, molecular docking and experimental validation
Back to article
Figure 5
(5 of 8)
−
100%
+
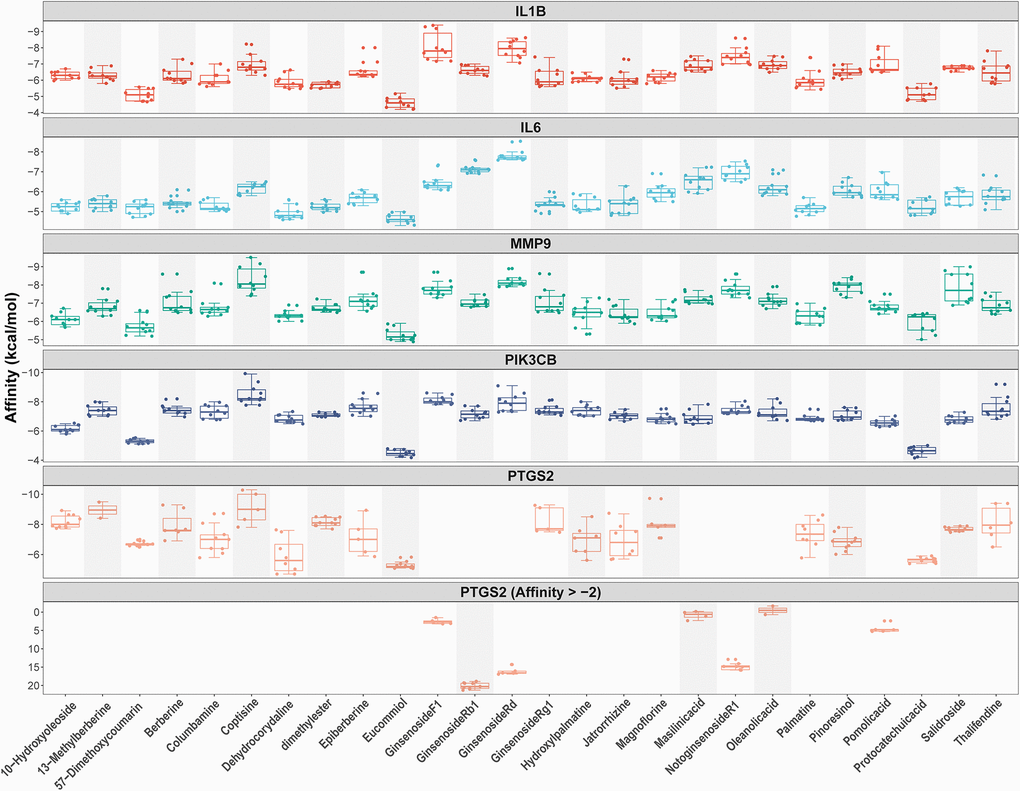
Figure 5.
Docking models between all compounds and enriched genes of the TNF pathway are shown as boxplot.
Each point represents the affinity of docking pose between a compound (ligand) and an enriched gene (receptor).