Submit an Article
Navigate
Home
Editorial Board
Editorial Policies
Current Volume
Archive
Scientific Integrity
Publication Ethics Statements
Interviews with Outstanding Authors
Newsroom
Sponsored Conferences
Podcast
Contact
Special Collections
Submit an Article
Online ISSN: 1945-4589
Research Paper
|
Volume 14, Issue 13
|
pp. 5571–5589
A novel prognostic signature of metastasis-associated genes and personalized therapeutic strategy for lung adenocarcinoma patients
Back to article
Figure 3
(3 of 14)
−
100%
+
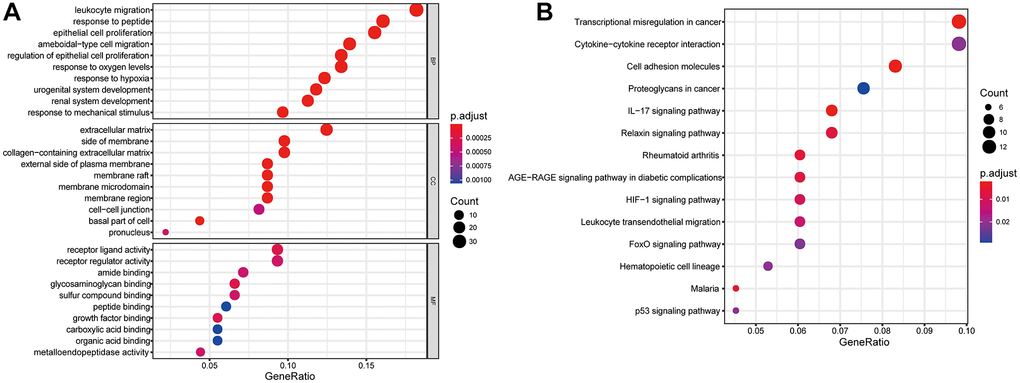
Figure 3.
Gene functional enrichment analysis of differentially expressed MAGs.
(
A
) GO and (
B
) KEGG analyses.