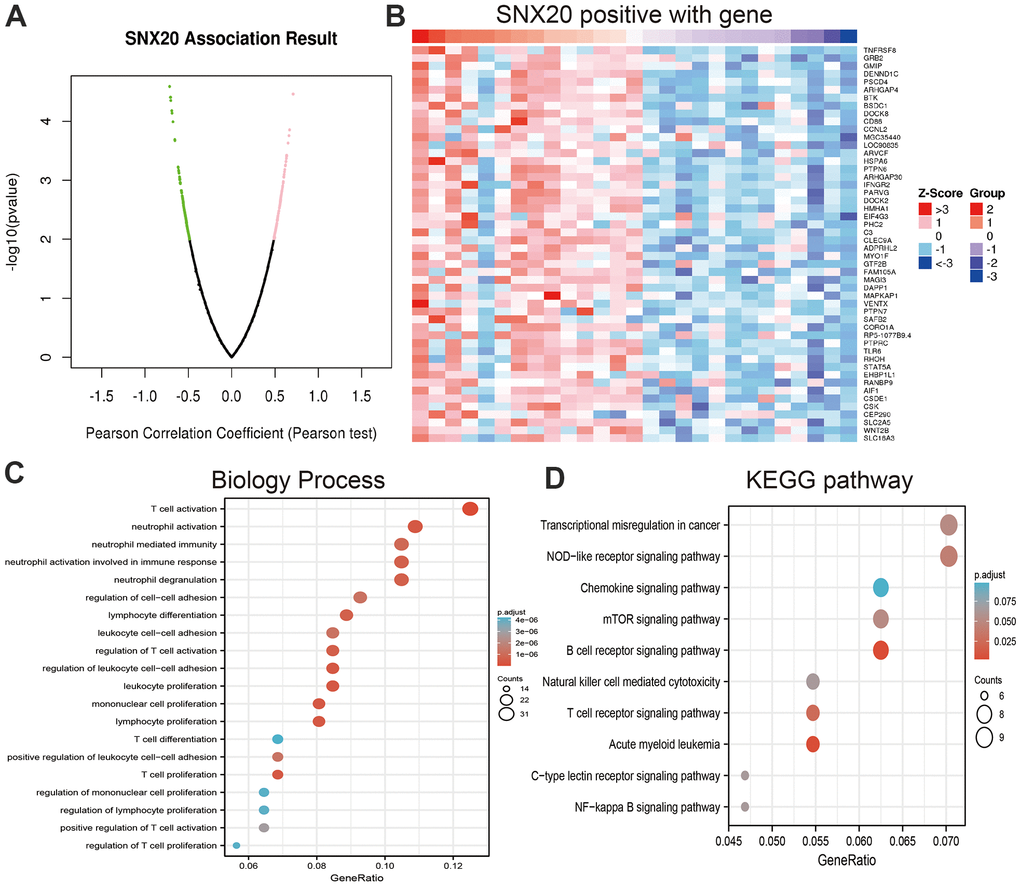
Figure 5.Analysis the function of SNX20 expression in LGG. (A, B) Analysis the co-expression genes of SNX20 in LGG examined by linkomics databases. (C) Analysis the biology process involved by SNX20 in LGG. (D) Analysis the KEGG signaling pathway of SNX20 in LGG.