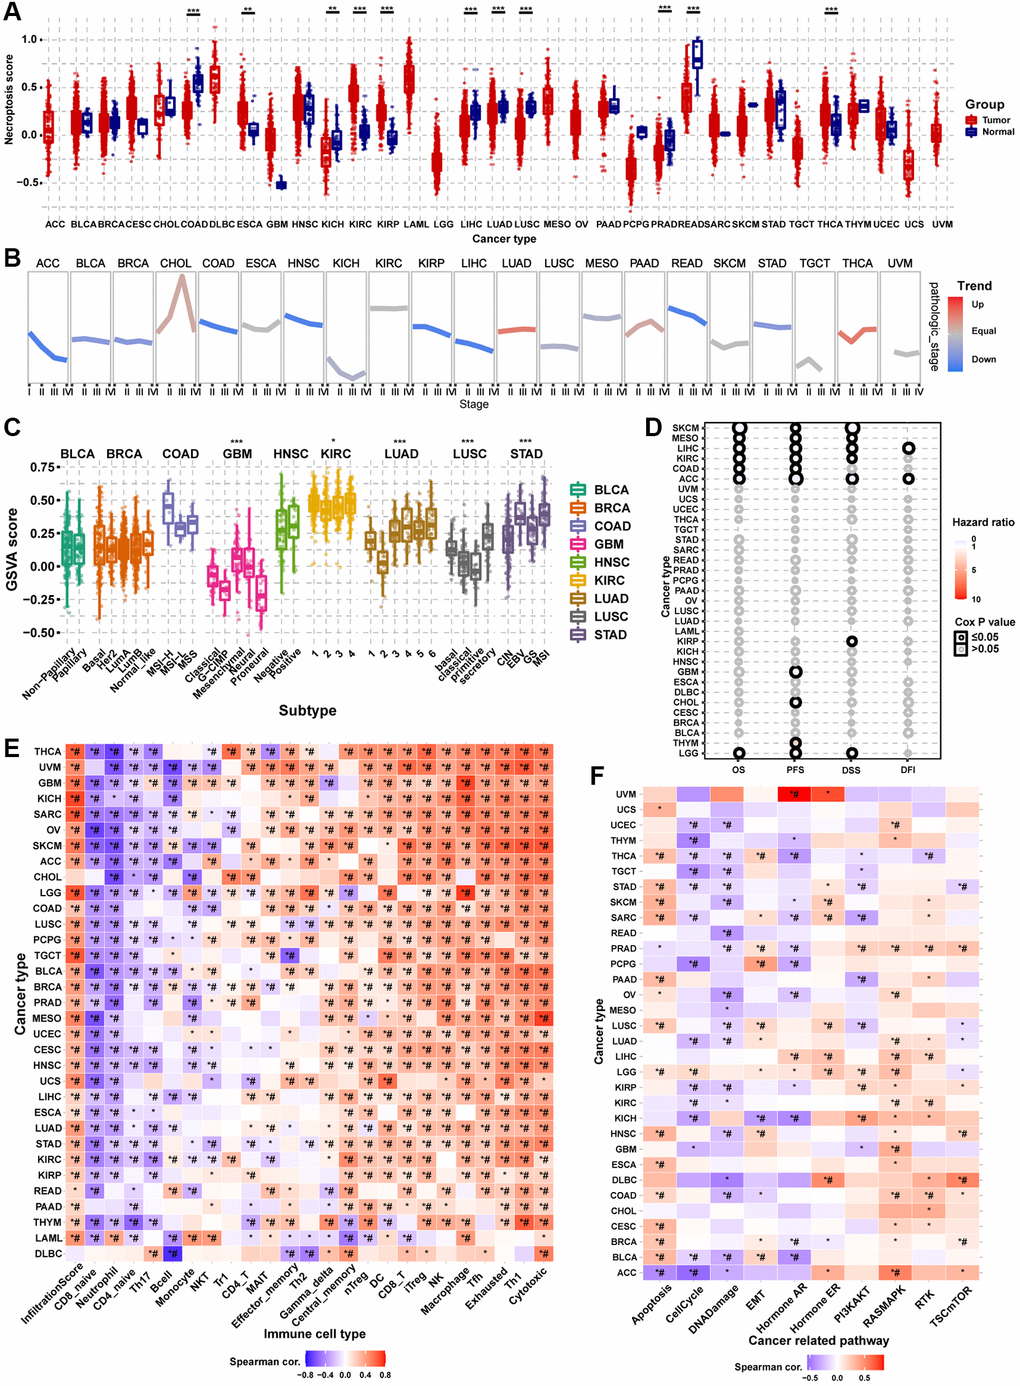
Figure 8.Gene Set Enrichment Analysis (GSVA) analysis of necroptosis-related regulators. (A) The differences of necroptosis score between tumor and normal samples in pan-cancer. The necroptosis score represents the integrated level of the expression of necroptosis-related regulators, which is positively correlated with gene expression. (B) The trend of the necroptosis score from stage I to stage IV in different cancers. The blue trend line and red trend line represent fall and rise tendency, respectively. (C) Box plot showing the differences of necroptosis score between different cancer subtypes. (D) Survival analysis of necroptosis score in different cancer types, including overall survival (OS), progression-free survival (PFS), disease-specific survival (DSS), and disease-free survival (DFI). (E) Heatmap showing the correlation between the necroptosis score and immune cell infiltration in different cancer types. *P ≤ 0.05; #FDR ≤ 0.05. (F) Heatmap showing the correlation between the necroptosis score and pathway activity in different cancer types. *P ≤ 0.05; #FDR ≤ 0.05.