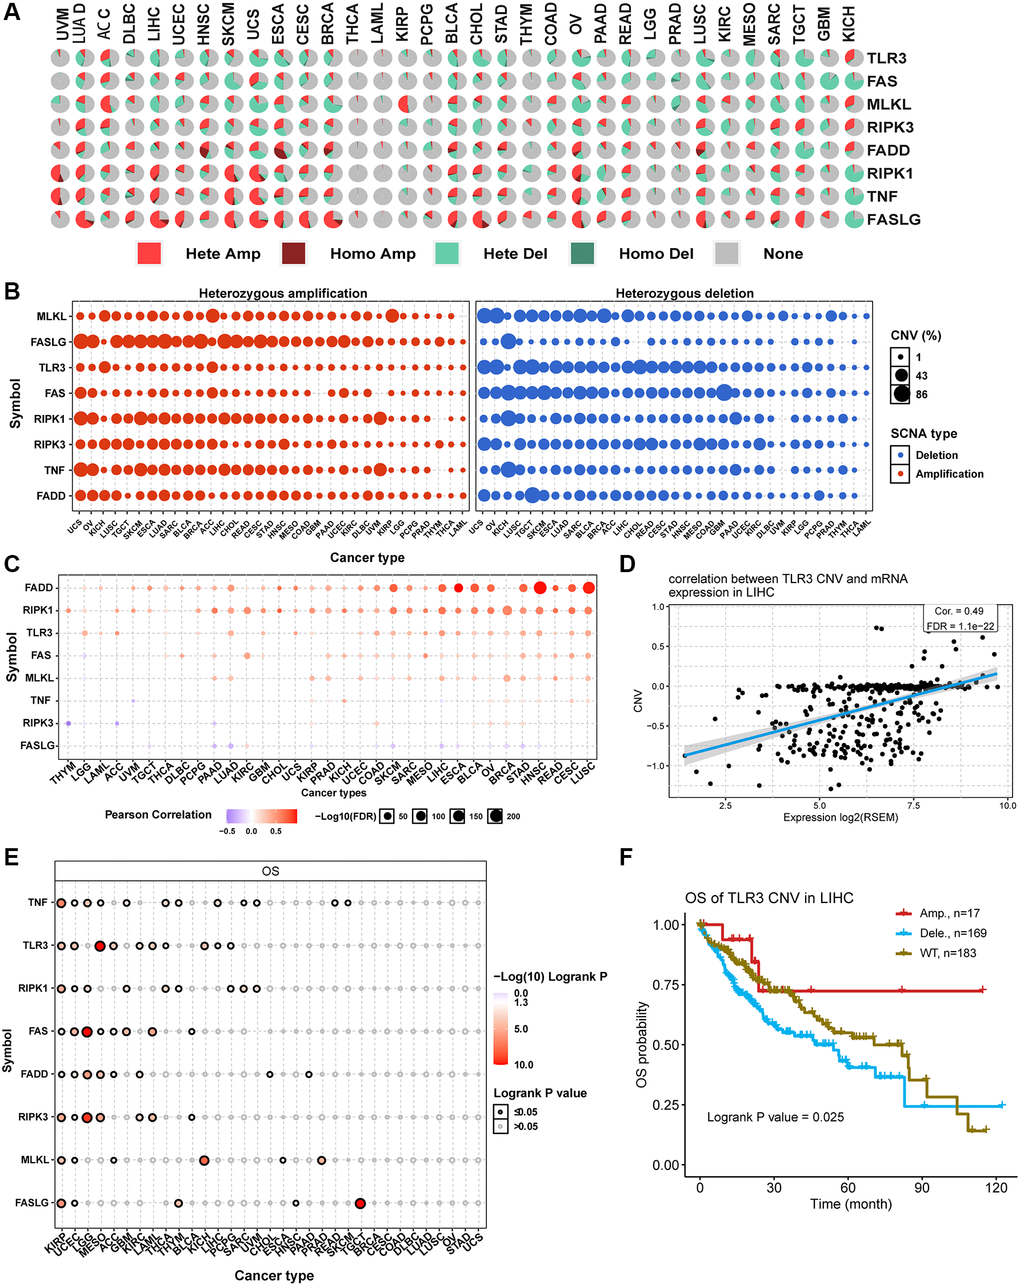
Figure 4.Copy number variation (CNV) analysis of necroptosis-related regulators. (A) CNV pie plot showing the constitute of Heterozygous/Homozygous CNV of necroptosis-related regulators in different cancers. Hete Amp, heterozygous amplification; Homo Amp, homozygous amplification; Hete Del, heterozygous deletion; Homo Del, homozygous deletion; None, no CNV. (B) Heterozygous CNV plot showing the percentage of heterozygous amplification (red bubble) and deletion (blue bubble) of necroptosis-related regulators in different cancers. The bubble size is positively correlated with percentage. (C) The association between CNV level and mRNA expression of necroptosis-related regulators in different cancers. Blue bubble and red bubble represent negative and positive correlations, respectively. The deeper the color, the stronger the correlation. Bubble size is positively correlated with the FDR significance. (D) Scatter plot showing the correlation between TLR3 CNV and its mRNA expression in LIHC. (E) CNV survival analysis of necroptosis-related regulators in different cancers. (F) Kaplan-Meier curve showing the survival difference between different CNV types and wild type of TLR3 in LIHC.