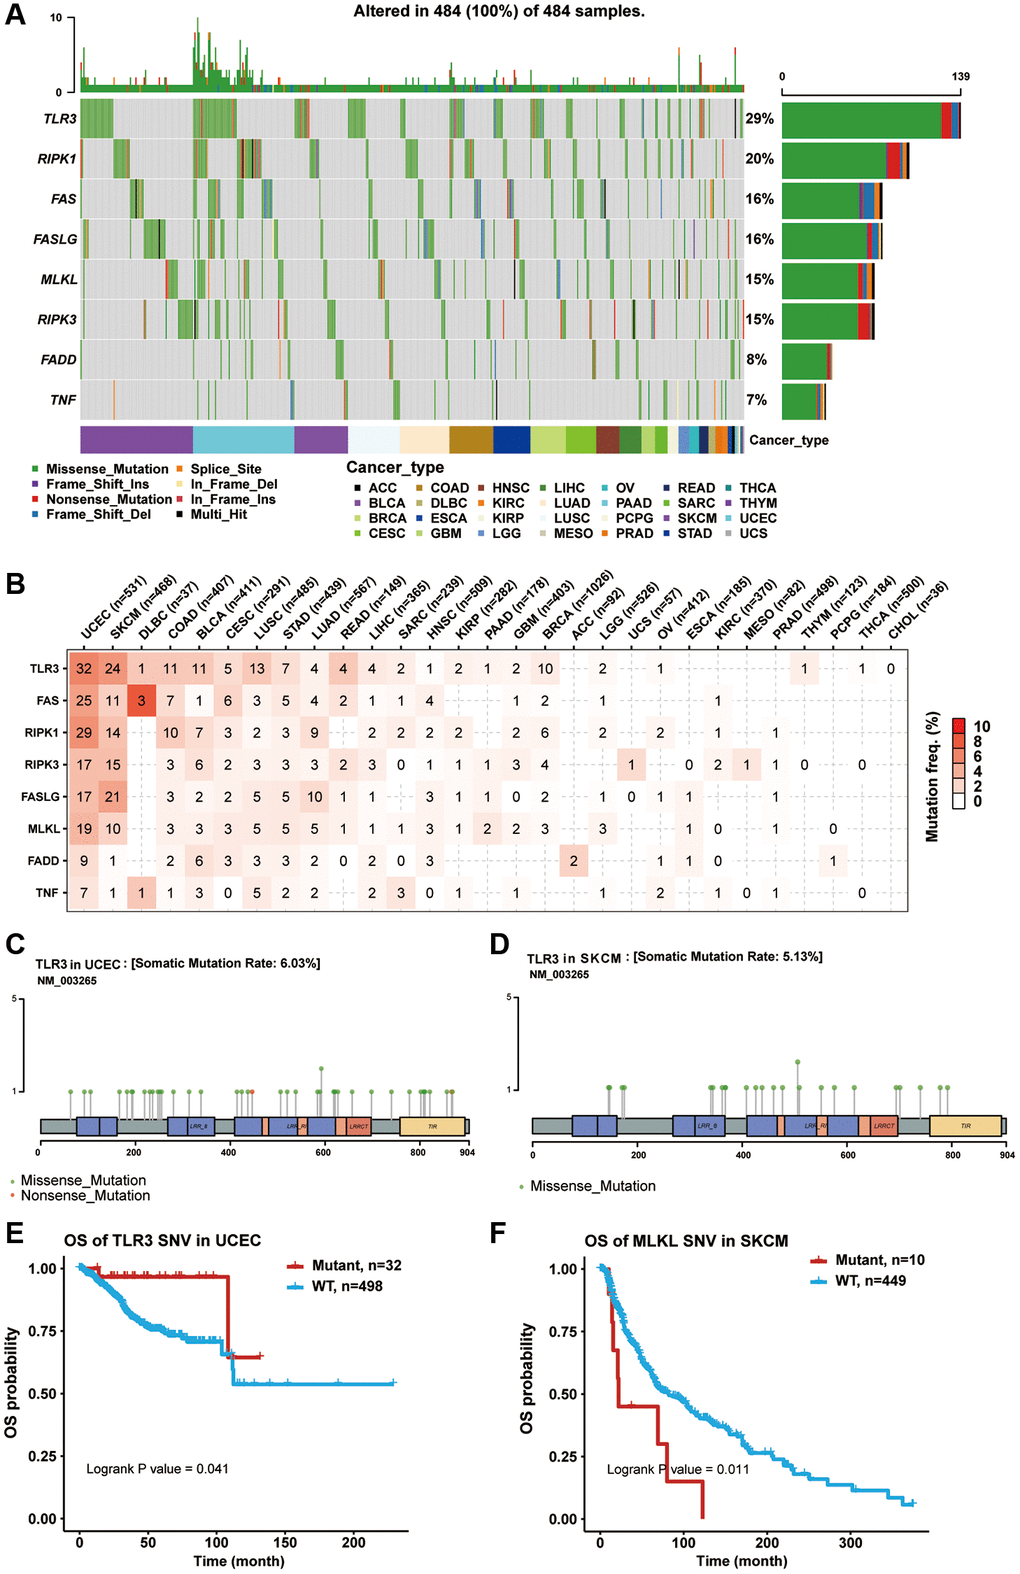
Figure 3.Single nucleotide variation (SNV) analysis of necroptosis-related regulators. (A) Oncoplot showing the SNV frequency distribution of necroptosis-related regulators in pan-cancer. Side barplot and top barplot show the number of variants in each gene and each sample, respectively. (B) The percentage heatmap showed the SNV frequency of necroptosis-related regulators in specific cancer type. The color depth is positively correlated with mutate frequency. The number in each cell represents the number of mutated samples in specific cancer. The 0 and blank in the cell indicate there is no mutation in specific gene coding region and all regions of a specific gene, respectively. (C) Lollipop plot showing the mutation site, type and frequency of TLR3 in UCEC. (D) Lollipop plot showing the mutation site, type and frequency of TLR3 in SKCM. (E) Kaplan-Meier curve between WT and Mutant groups of TLR3 in UCEC. (F) Kaplan-Meier curve between WT and Mutant groups of MLKL in SKCM.