Submit an Article
Navigate
Home
Editorial Board
Editorial Policies
Current Volume
Archive
Scientific Integrity
Publication Ethics Statements
Interviews with Outstanding Authors
Newsroom
Sponsored Conferences
Podcast
Contact
Special Collections
Submit an Article
Online ISSN: 1945-4589
Research Paper
|
Volume 14, Issue 11
|
pp. 4874–4887
Effective natural inhibitors targeting IGF-1R by computational study
Back to article
Figure 5
(5 of 6)
−
100%
+
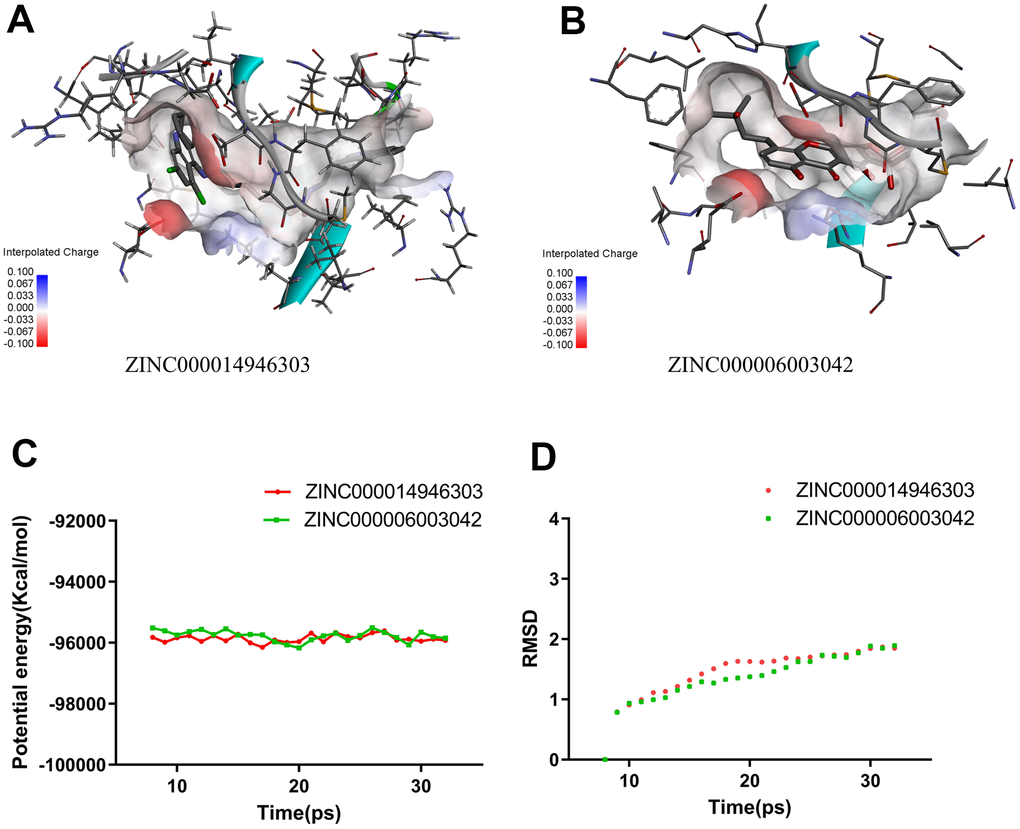
Figure 5.
Schematic drawing of interactions between ligands and IGF-1R.
(
A
) ZINC000014946303-IGF-1R complex. (
B
) ZINC000006003042-IGF-1R complex. (
C
) Potential Energy. (
D
) Average backbone RMSD.
Figure 5 — Effective natural inhibitors targeting IGF-1R by computational study | Aging