Submit an Article
Navigate
Home
Editorial Board
Editorial Policies
Current Volume
Archive
Scientific Integrity
Publication Ethics Statements
Interviews with Outstanding Authors
Newsroom
Sponsored Conferences
Podcast
Contact
Special Collections
Submit an Article
Online ISSN: 1945-4589
Research Paper
|
Volume 14, Issue 11
|
pp. 4739–4754
A novel immune-related microRNA signature for prognosis of thymoma
Back to article
Figure 4
(4 of 5)
−
100%
+
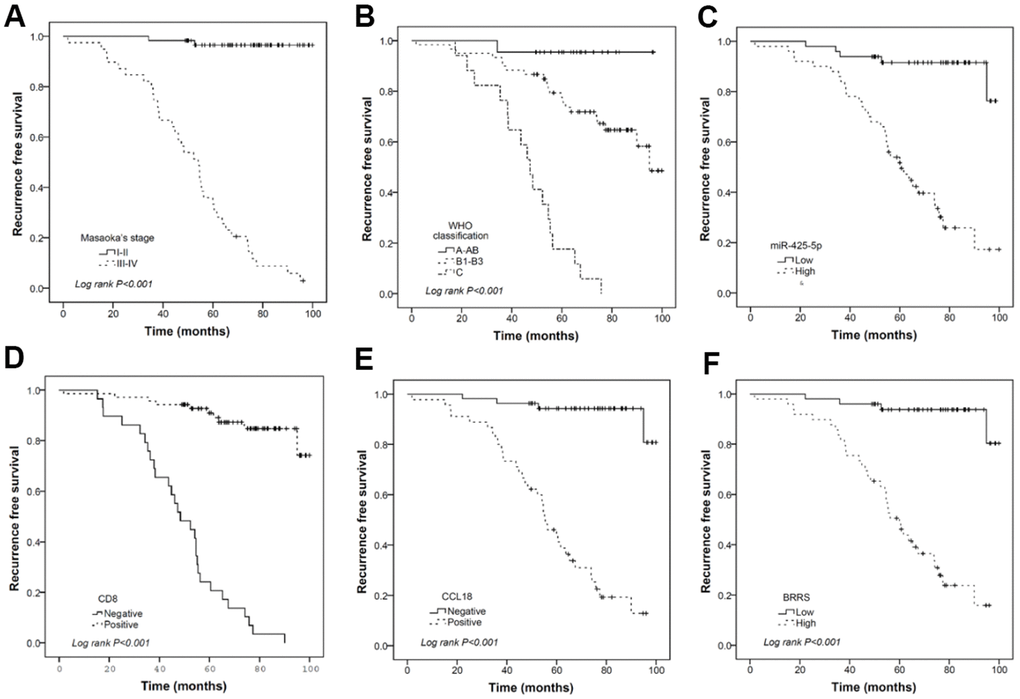
Figure 4.
Kaplan-Meier curves illustrating the prognostic effects of Masaoka stage (
A
), WHO classification (
B
), miR-425-5p (
C
), CD8 (
D
), CCL18 (
E
), and BRRS (
F
) categorized by corresponding median values. (n = 120 THYM samples).
Figure 4 — A novel immune-related microRNA signature for prognosis of thymoma | Aging