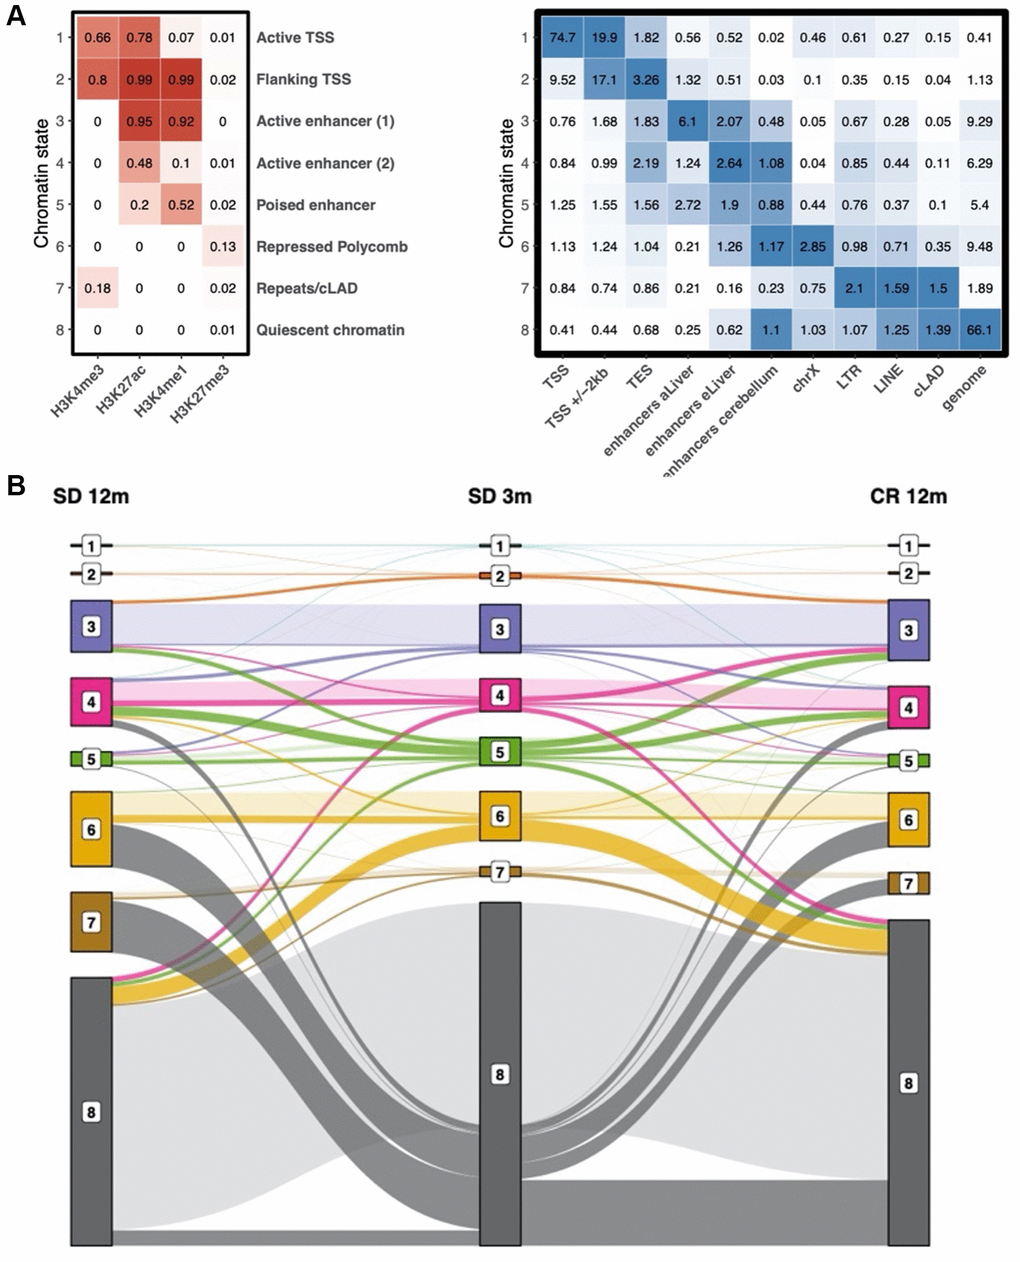
Figure 4.Chromatin state definition and transitions between states with age. (A) Chromatin state definition, labels and enrichment of selected groups of functional elements in young samples. Number in the heatmap on the left are probabilities of observing a given histone modification in the respective chromatin state. Number in the heatmap on the right are enrichment values obtained by ChromHMM for each combination of chromatin state and feature. (B) alluvial plot showing the transition between chromatin states in the SD 3m (center), SD 12m (left), and CR 12m (right) groups. Bar height represents genome coverage in percent (all states together are 100%).