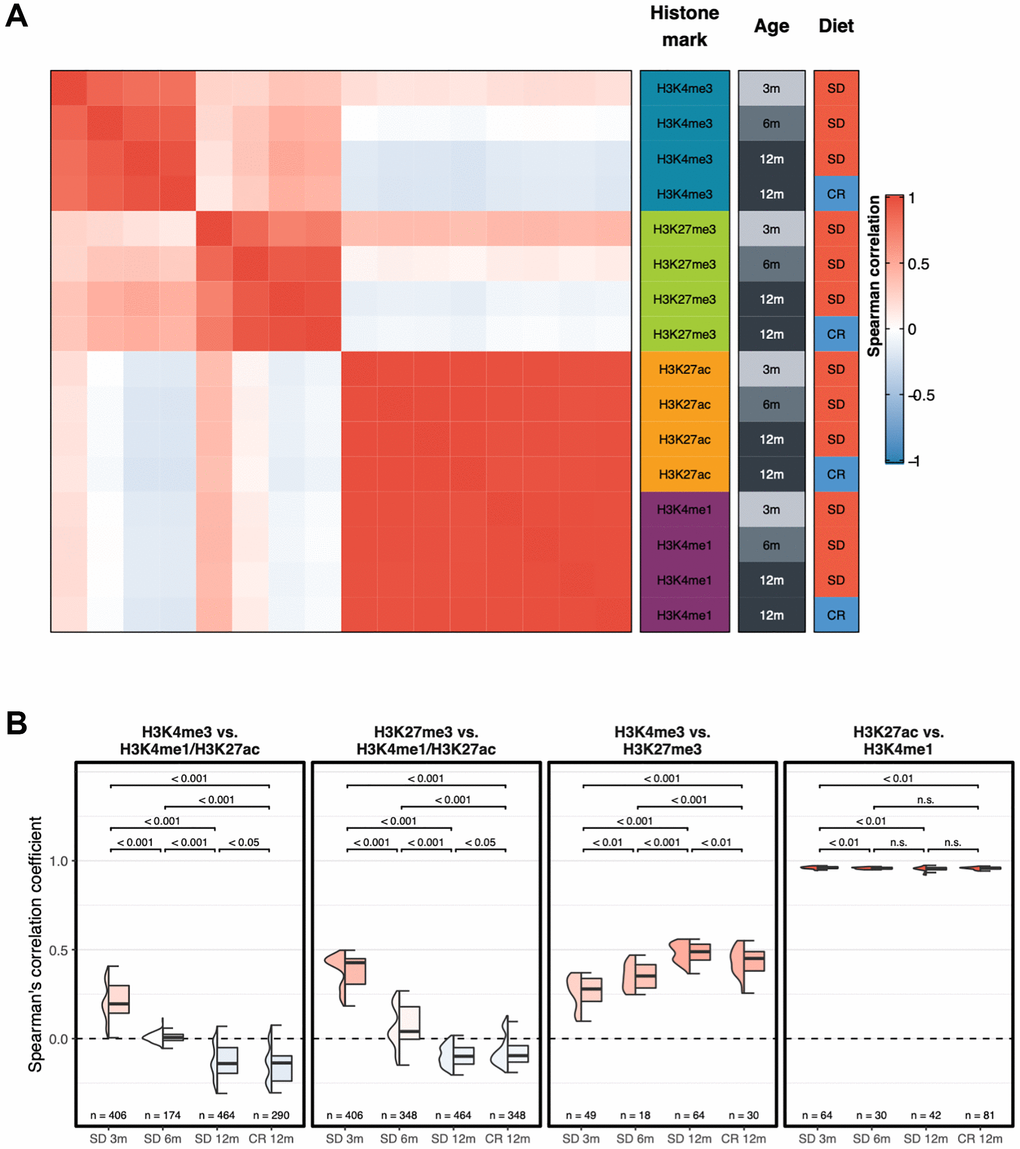
Figure 2.Genome-wide correlation patterns between histone modifications by group. (A) Heatmap showing the Spearman’s correlation coefficient for each combination of experimental groups after merging the replicates. (B) Box plots of Spearman’s correlation coefficients of each replicate between different groups of histone modifications. Two-sided Wilcoxon test p-value are shown.