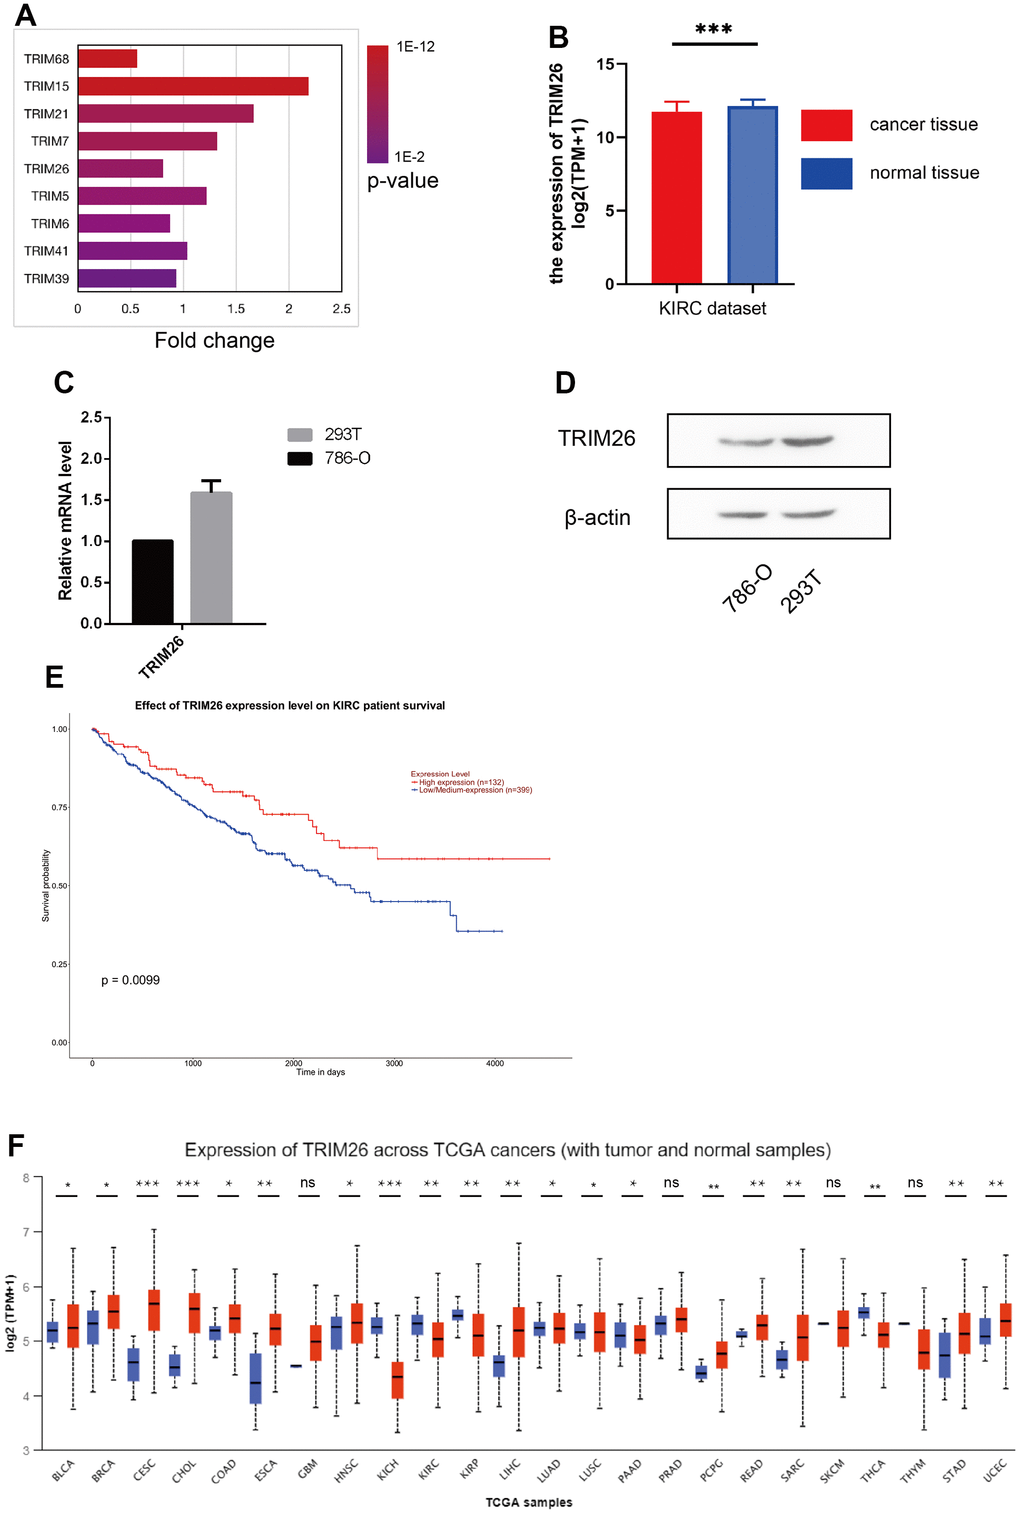
Figure 1.(A) 9 TRIM genes expression level in the KIRC dataset; (B) TRIM26 expression level in the KIRC dataset; (C, D) TRIM26 expression level in Q-PCR or WB analysis; (E) The survival analysis of TRIM26 in the KIRC dataset by the UALCAN; (F) The TRIM26 expression level in the TCGA pan-cancer tissue.