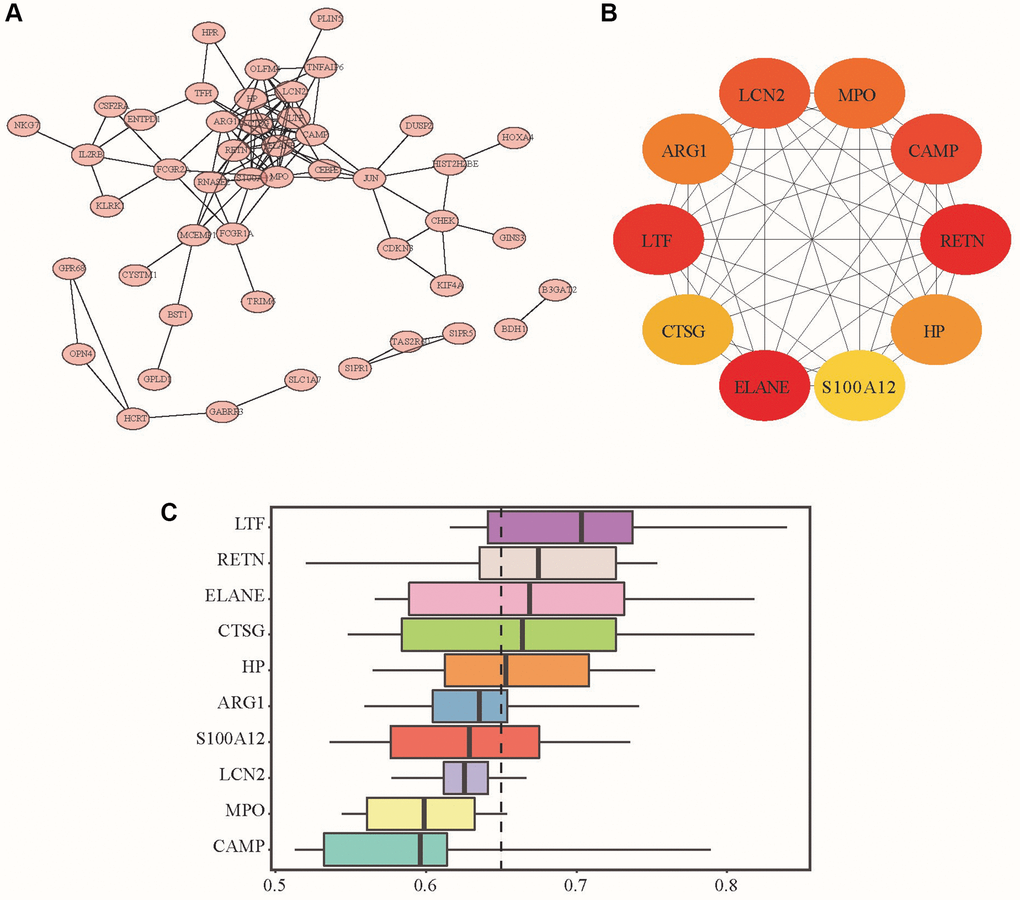
Figure 2.PPI network, hub genes and DEG functional similarity scores. (A) PPI network analysis diagram; (B) Hub gene schematic diagram: the redder the color is, the higher the enrichment score is, and the yellow represents the relatively small enrichment score. (C) The distribution of the functional similarity of different genes is summarized as a box plot. The middle of these boxes represents 50% similarities; the upper and lower borders show the 75th and 25th percentiles. The line in the box represents the average value of functional similarity.