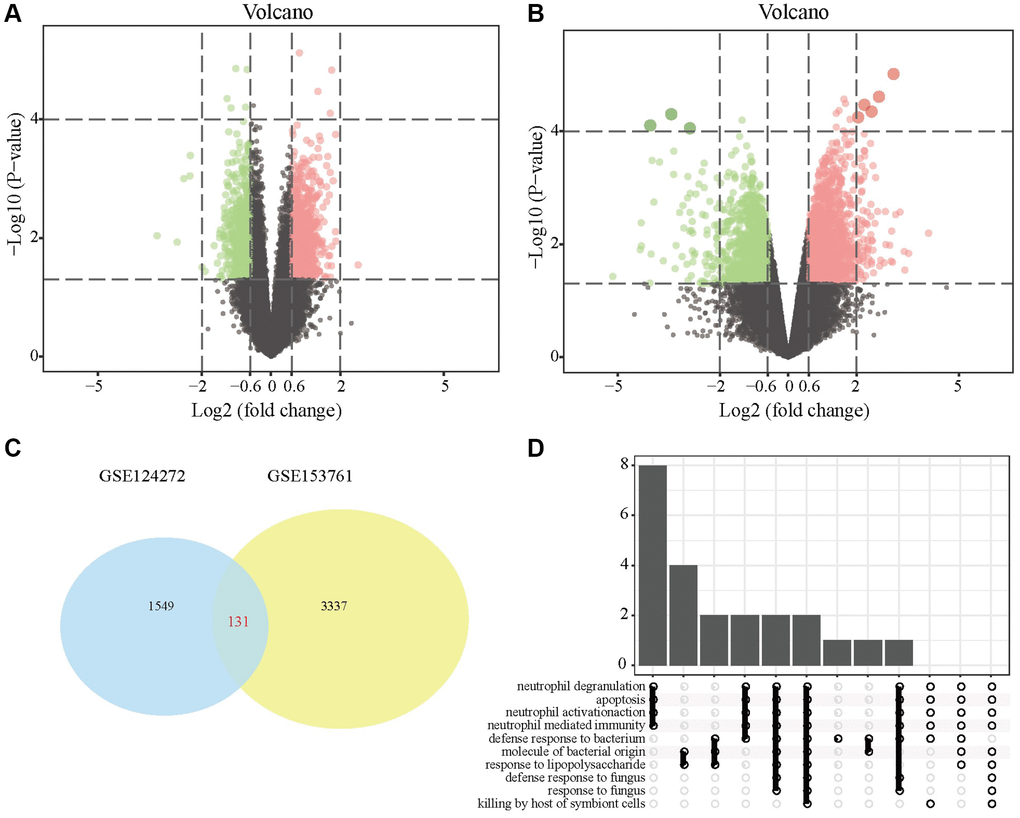
Figure 1.DEGs in IDD tissues and normal tissues. (A) DEG volcano map in the GSE124272 data set; (B) DEG volcano map in the GSE124272 data set; (C) Venn diagram of the intersection of the DEGs of the two data sets GSE124272 and GSE153761. (D) Enrichment analysis of the KEGG signaling pathways of DEGs.